
Scrap in aerospace manufacturing is not a shopfloor housekeeping issue. It is a program-level financial event with direct consequences for margin, capacity, and contractual performance. When a titanium forging or a machined nickel superalloy component fails inspection late in its routing, the loss extends far beyond material cost. The hours of machining, special processing, and skilled labor invested in that part are gone. The machine capacity consumed cannot be recovered. The delivery slot committed to Boeing or Airbus is now at risk.
Aerospace programs operate on long timelines, often spanning 10 to 15 years of production. Within those programs, scrap rates compound. A 2% yield loss on a flight-critical subassembly does not stay at 2% in isolation. It displaces capacity needed for on-time new production, drives expedited remake orders, and creates ripple effects across suppliers, inspection queues, and program schedules. For organizations managing multiple programs across multiple sites, these effects multiply further.
This article provides an executive-level framework for understanding scrap and cost of poor quality in aerospace manufacturing. The goal is not to prescribe a checklist but to offer a structured way of thinking about where scrap originates, how its costs propagate, and what governance and process disciplines protect margin and program performance. Connect981 works with aerospace manufacturing and MRO organizations, so the perspective here is grounded in regulated operations. However, the focus remains on strategy and framework rather than tools.
Defining Scrap and Nonconformance in an Aerospace Context
Precision in terminology matters when discussing aerospace scrap reduction. The word “scrap” often gets used loosely, but in regulated aerospace environments, it carries specific meaning within a broader system of nonconformance management.
Scrap refers to material that cannot be brought into conformance with approved requirements and must be destroyed or disposed of outside the aerospace supply chain. Once a part is scrapped, all invested labor, material, and processing are unrecoverable.
Rework is the process of bringing nonconforming material into full conformance with the original design requirements through additional processing. A machined dimension that falls slightly outside tolerance may be corrected through additional machining, provided the correction remains within drawing limits.
Repair differs from rework in that the part is brought to a condition that meets the intended function but does not fully conform to the original design. Repairs require engineering approval and often customer or design authority concurrence.
Concession (sometimes called a deviation or use-as-is disposition) allows a nonconforming condition to be accepted without correction. This requires formal engineering evaluation and documented approval, typically from the design authority or customer.
Nonconforming material, in the broader sense, includes any deviation from the approved configuration, drawing, specification, or process plan. A flight-critical turbine blade failing dimensional inspection is nonconforming. A composite spoiler panel with porosity outside specification limits is nonconforming. A fastener lot missing required certifications is nonconforming. The eventual disposition may be scrap, rework, repair, or concession, but the material is nonconforming from the moment the deviation is identified.
Understanding nonconformance rates requires looking at both part family and process. Special processes such as heat treatment, NDT, plating, and welding often generate characteristic nonconformance patterns that differ from machining or assembly operations. Tracking nonconformance by process family reveals systemic issues that part-level tracking alone may obscure.
Scrap as a Financial and Program Risk Event
In aerospace manufacturing, each scrap event is both a financial loss and a program risk event. The financial dimension is visible; the program risk dimension is often underestimated.
Consider a concrete example. A titanium forging enters the factory with a raw material value of approximately $18,000. By the time it has undergone 40 hours of precision machining and multiple special processes, the invested value may exceed $50,000. If that part fails inspection at a late operation and cannot be reworked, the entire invested value is lost. The material cost is substantial, but the capacity consumed is equally significant. Those 40 machine hours, the skilled labor, the special process slots, and the floor space occupied during work-in-process are unrecoverable. They were consumed producing a part that will never ship.
This capacity displacement effect is central to understanding aerospace scrap economics. Rework and remake orders compete for the same limited resources needed for on-time new production. When a serialized assembly is scrapped late in its routing, the replacement order does not simply queue behind existing work. It often triggers expedited processing, overtime, and priority scheduling that disrupts the flow of other orders. The true cost includes not only the direct loss but also the indirect impact on overall production efficiency.
Schedule and delivery risk compounds the financial impact. Aerospace programs operate on tightly coordinated delivery schedules. A scrapped configuration-controlled assembly destined for an Airbus A350 or a Boeing 787 does not merely represent a financial loss. It may jeopardize a contractually committed delivery slot. Missed milestones, whether during CDR, LRIP volume ramps, or retrofit campaigns, can trigger penalties, liquidated damages, or fee-at-risk clauses on performance-based contracts.
For MRO operations, the dynamics are even more compressed. Scrapping an in-service component during repair can trigger AOG exposure, customer penalties, and unplanned material replacement costs. The timeline for recovery is measured in days rather than weeks, and customer satisfaction depends on timely delivery that scrap events directly threaten.
The True Cost of Poor Quality in Aerospace Manufacturing
The classic cost of poor quality framework divides quality costs into four categories: prevention, appraisal, internal failure, and external failure. In aerospace, each category carries specific operational meaning that differs from general manufacturing.
Prevention costs represent investments made to prevent defects from occurring. In aerospace, this includes defining robust special process controls, training licensed inspectors, developing and qualifying suppliers, conducting detailed Failure Modes and Effects Analyses (FMEAs), and performing process capability studies. Prevention costs are proactive investments that reduce the probability of nonconformance downstream. Organizations that underinvest in prevention often see the consequences surface as chronic yield loss and elevated rework rates.
Appraisal costs are the expenses incurred to detect nonconformance before it reaches the customer. Aerospace appraisal costs are substantial because of the nature of flight-critical hardware. They include 100% inspection of critical characteristics, first article inspection (FAI) requirements, NDT across multiple methods, functional testing, and the redundant signoffs required by AS9100 and customer quality standards. These costs are necessary but represent resources that do not directly add value to the product.
Internal failure costs arise when nonconformance is detected before delivery. This category includes scrap, rework, re-inspection, MRB (Material Review Board) activity, engineering dispositions, line stoppages, and expedited remake orders. Internal failures consume capacity, extend lead times, and generate administrative burden. In many aerospace facilities, internal failure costs represent the largest component of COPQ but are often underreported because rework hours and MRB activity are not always tracked as distinct cost categories.
External failure costs occur when nonconformance escapes to the customer or into service. In aerospace, external failures can be severe: field findings, service bulletins, warranty claims, retrofit campaigns, and in the most serious cases, reportable events to the Federal Aviation Administration or EASA. External failure costs extend beyond direct remediation to include reputational damage, customer relationship strain, and potential regulatory action that affects future business. The safety risks associated with external failures in aerospace mean that even low-frequency events carry disproportionate consequence.
A critical insight for aerospace executives is that internal failures often mask external risk. Parts “saved” through repair or concession still add lifecycle cost. A component that required multiple engineering dispositions during production may perform adequately in service but represents elevated operational risk and reduced margin. Concession volume is a leading indicator of process capability issues that, left unaddressed, eventually surface as external failures.
In many mid-size aerospace plants, COPQ silently consumes 3% to 8% of sales revenue. This figure is rarely visible in standard financial reporting because quality costs are distributed across labor, material, and overhead accounts. Making COPQ visible as a distinct metric is a precondition for managing it strategically.
Aerospace Quality Cost Drivers: Where Scrap Really Starts
Most aerospace scrap and manufacturing waste originate upstream, in design decisions, process discipline, and configuration control, rather than at final inspection. Understanding where scrap starts is essential for executives who want to target prevention rather than remediation.
Complex geometries and tight tolerances create inherent process risk. Aerospace components frequently require tolerances that approach the limits of available process capability. When design specifications leave insufficient margin for normal process variation, chronic yield loss becomes inevitable regardless of operator skill or equipment condition. This is a design-manufacturing interface issue that requires early collaboration between engineering and production.
Late design changes disrupt established processes and introduce new failure modes. A drawing revision late in the production stage may invalidate existing tooling, work instructions, and inspection criteria. The transition period between revisions often generates elevated scrap rates as the production process adjusts to new requirements. Effective change management includes assessing the production impact of design changes before release.
Inadequate process FMEAs leave potential failure modes unaddressed. When process failure mode analysis is superficial or incomplete, controls are not put in place for high-risk operations. The consequence is that defects are detected only at inspection rather than prevented through process discipline. Process improvement depends on rigorous upfront analysis that anticipates where problems will occur.
Configuration control issues represent a systemic source of nonconformance. When the wrong revision of a drawing or work instruction reaches the production line, when obsolete specifications are applied, or when software part numbers do not match hardware configurations, systemic scrap results. These are not operator errors but governance failures that affect entire production lots.
Supplier-related drivers extend the quality cost picture beyond the factory walls. Inconsistent raw material properties, incomplete certification packages, unqualified special process sources at sub-tier suppliers, and poor change control across the supply chain all generate nonconformance that surfaces during receiving inspection or, worse, during production. Supply chain efficiency depends on supplier quality management that extends beyond audit compliance to genuine process capability at source.
Human factors contribute to quality issues even when processes are well-designed. Overloaded operators, unclear work instructions, ambiguous inspection criteria, and shift-to-shift variation in interpretation all generate inconsistency. Reducing human error requires not only training but also clear, unambiguous work standards that leave minimal room for interpretation.
A hidden driver of aerospace COPQ is the “heroic recovery culture” that develops in some organizations. When MRB activity, engineering dispositions, and last-minute concessions become routine rather than exceptional, the organization has normalized nonconformance. The costs are absorbed into standard operations and become invisible. Breaking this pattern requires making the cost of recovery visible and shifting investment toward prevention.
Scrap, Process Capability, and Special Process Control
Persistent scrap rates often trace back to inadequate process capability and weak control of special processes. In aerospace manufacturing, process capability indices (Cp, Cpk) are not academic exercises but operational predictors of yield and scrap.
Special processes present particular challenges. Heat treatment, shot peening, NDT, bonding, plating, and welding produce characteristics that are not fully verifiable by subsequent inspection. The material properties imparted by heat treatment, for example, cannot be confirmed by measuring a finished dimension. Process discipline becomes the primary safeguard against nonconformance. When special process controls are weak, defects escape detection until much later in the routing or, in some cases, until service.
For machining, forming, and composite layup, low process capability translates directly into chronic yield loss. Consider a recurring problem with out-of-tolerance bores on landing gear components. If tool stability is marginal and the process Cpk is below 1.0, the operation will produce 15% to 20% scrap and rework at that step regardless of operator attention. The solution is not additional inspection or operator discipline but addressing the process capability gap through tooling, fixturing, or method changes.
Complex routings amplify capability issues. When a part passes through multiple special processes and inspections, yield loss at each stage compounds. A 95% yield at each of five sequential operations results in overall yield below 77%. Tracking scrap rates only at final inspection obscures where in the routing the losses actually occur.
Executives should ensure that yield and scrap are tracked by operation and by process family, not only by finished part number. This visibility enables targeted investment in process optimization, tooling upgrades, and vendor qualification where the impact is greatest. Process capability improvement is a capital allocation decision, not merely a quality function responsibility.
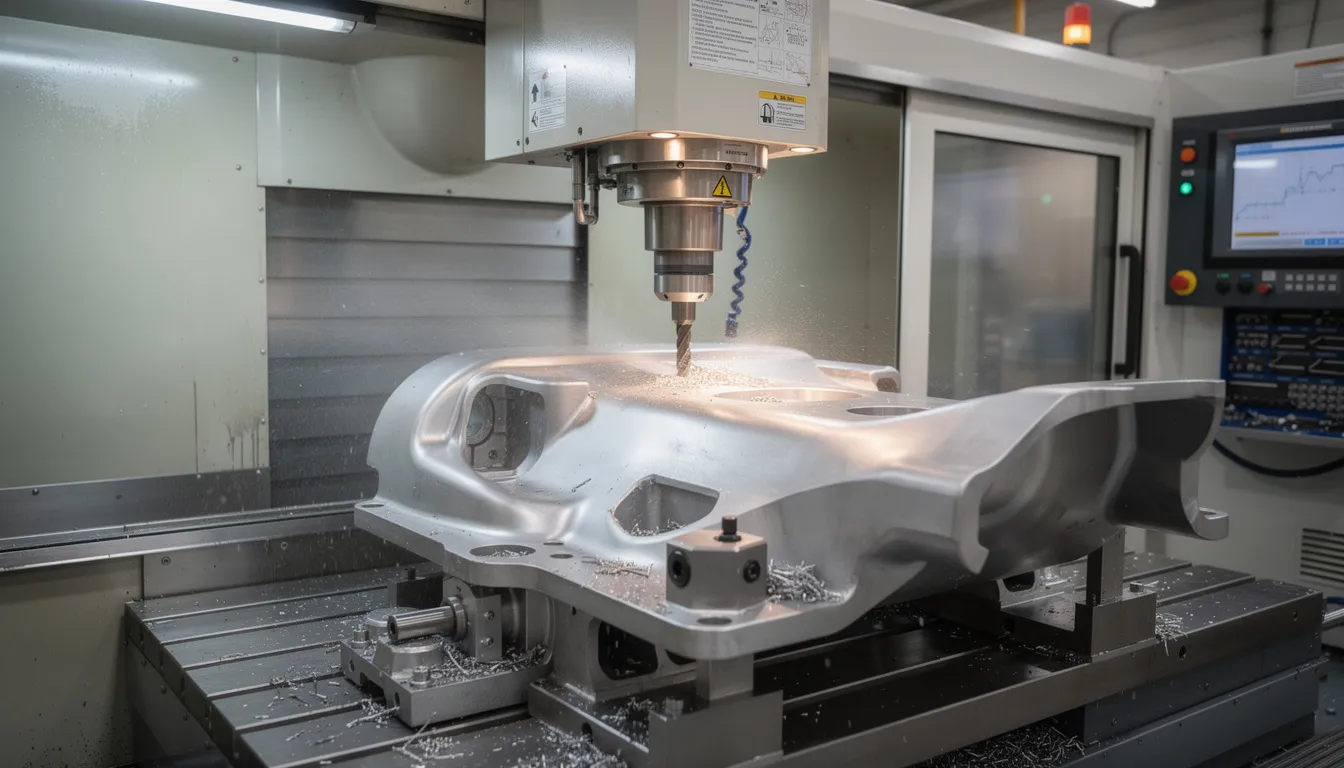
Nonconforming Material as a Capacity and Governance Problem
Nonconforming material control is often treated as a paperwork function, managed by quality specialists and handled through MRB procedures. In practice, NCM control is a capacity and governance discipline that affects flow, inventory accuracy, and compliance posture.
Uncontrolled NCM creates operational drag. Parts waiting for MRB disposition occupy floor space, tie up WIP inventory, and delay downstream operations. When segregation is unclear or disposition cycles are slow, the true status of work-in-process becomes uncertain. Production schedules are built on assumptions that are not aligned with actual material availability. The consequence is expedited orders, missed deliveries, and reactive firefighting that consumes management attention.
The typical MRB bottleneck reflects organizational rather than technical constraints. Engineering signoff delays, incomplete defect descriptions, and back-and-forth with design authorities or OEM customers extend disposition cycles. Each day a nonconforming part waits for disposition is a day it occupies capacity and distorts inventory reporting. Streamlining MRB processes requires clear responsibility assignments, consistent criteria for repair versus scrap versus concession, and predefined escalation paths for complex dispositions.
Governance risks accompany operational risks. Incomplete traceability, missing inspection records, and undocumented use-as-is decisions threaten AS9100 certification and regulatory compliance. Auditors, whether internal, customer, or regulatory, examine NCM handling as a leading indicator of quality management system effectiveness. Findings in NCM control often signal broader governance issues that affect the organization’s competitive position.
Consider a scenario: a batch of brackets with missing torque records arrives at final assembly. It is unclear whether re-torque is possible or whether the parts must be scrapped. The uncertainty triggers re-inspection, engineering involvement, and schedule slip. The customer escalates the issue, questioning the organization’s process discipline. What began as a documentation gap becomes a customer relationship issue with implications for future contract awards.
Disciplined NCM control, including prompt containment, clear responsibility, and consistent disposition criteria, protects both capacity and certification posture. NCM metrics belong on executive dashboards alongside delivery performance and financial results.
Containment Discipline: Protecting Programs From Cascading Scrap
Containment in aerospace refers to the rapid identification, segregation, and risk assessment actions taken when a defect or process escape is detected. Effective containment limits the scope of a quality event and prevents localized issues from becoming program-wide problems.
The near-term objectives of containment are clear: stop further escapes, protect flight safety, and prevent the spread of a defect across multiple serial numbers or lots. Containment actions must be immediate and decisive. Delay allows additional nonconforming product to be produced, shipped, or installed, increasing the eventual remediation cost.
Consider an example: in May 2024, a heat treatment load for engine mount brackets is discovered to have experienced a process deviation. The affected serials must be traced, and all potentially nonconforming material must be contained, whether in the factory, at customer facilities, or in service. The scope of the containment action depends on the quality of traceability data and the speed of the response. Weak traceability extends the containment boundary; slow response allows escapes to propagate.
Strong containment discipline requires predefined elements: clear triggers for containment actions, predefined cross-functional teams with authority to act, and standardized decision trees for determining whether inspection, rework, or recall is appropriate. These elements must be established before an event occurs, not improvised during a crisis.
The connection to program risk is direct. Weak containment can transform a localized scrap event into a fleetwide retrofit campaign. A defect that could have been contained to 50 serial numbers may spread to 500 or 5,000 if identification and segregation are slow. The financial and reputational damage scales accordingly.
Root Cause Rigor in Aerospace Scrap Reduction
In aerospace, superficial root cause analysis leads to recurring scrap on serialized, high-value parts. When the same nonconformance recurs month after month, margin erodes and customer confidence declines. Rigorous RCA is a capability that distinguishes organizations that achieve continuous improvement from those that remain stuck in reactive cycles.
Structured RCA methods are familiar in aerospace: 8D, 5-Why, fishbone (Ishikawa) diagrams, and fault tree analysis. The choice of method matters less than the rigor with which it is applied. The critical distinction is between symptom-level fixes and systemic root causes.
Symptom-level fixes address the immediate manifestation of a problem without resolving its underlying cause. Adding inspection, issuing temporary rework instructions, or increasing sample rates may reduce escapes in the short term but do not prevent recurrence. Systemic root causes require deeper investigation: process windows that are too narrow, tooling concepts that are fundamentally flawed, or specification misalignment between customer requirements and supplier capabilities.
A concrete example illustrates the distinction. Repeated concessions on fastener hole mismatch during 2022 and 2023 were initially attributed to operator variability. Additional training was provided, but concessions continued. A data-driven investigation eventually traced the issue to misinterpreted GD&T in a legacy drawing combined with inconsistent fixture datum schemes across production cells. The root cause was not operator performance but a design-manufacturing interface issue that required drawing clarification and fixture standardization.
Data-backed RCA is essential for avoiding bias and tribal explanations. Linking nonconformance codes to process parameters, supplier lots, and equipment identifiers enables pattern recognition that anecdotal analysis cannot achieve. Advanced analytics and predictive analytics can accelerate this process by surfacing correlations across large datasets.
RCA outcomes must translate to controlled change: updating process plans, re-qualifying special processes, revising training and competency requirements, and, when necessary, updating FAIs. Corrective and preventive actions that exist only in documentation without operational implementation provide no benefit. The measure of RCA effectiveness is whether the nonconformance recurs.

Governance, AS9100, and the Cost of Nonconformance
AS9100 and related aerospace quality standards are often viewed as compliance obligations. In practice, they are governance frameworks that shape how scrap and nonconformance are prevented, detected, and managed. Weak governance surfaces as quality cost; strong governance protects margin.
Key governance elements include documented configuration control, formal change management, supplier approval and monitoring, and structured handling of concessions and deviations. Each element affects COPQ outcomes. Uncontrolled design changes generate nonconformance when production builds to obsolete requirements. Inconsistent application of customer specifications leads to parts that meet internal standards but fail customer inspection. Ad hoc dispositions create precedents that are difficult to sustain under audit scrutiny.
Audit and regulatory exposure is a practical consequence of governance gaps. Incomplete traceability, missing inspection records, and inconsistent MRB decisions trigger findings from customer quality representatives, FAA Designated Engineering Representatives, or EASA auditors. These findings are not merely administrative inconveniences. They signal to customers that the organization’s quality management system may not be reliable, affecting future business and contract negotiations.
Governance is a shared responsibility across operations, quality, engineering, and program management. Treating it as solely a quality function responsibility guarantees gaps. When engineering releases changes without assessing production impact, when operations deviates from approved methods to meet schedule, or when program management accepts elevated risk without documented justification, governance erodes. The costs surface later as scrap, rework, concessions, and audit findings.
Tightening governance directly reduces chronic NCM. When change control is rigorous, configuration errors decline. When MRB criteria are consistent and well-documented, disposition cycles shorten. When supplier approval includes process capability requirements, incoming material quality improves. Governance investment is prevention investment.
From Local Fixes to a Coherent Scrap Reduction Strategy
Isolated lean projects or local quality campaigns are insufficient for sustainable aerospace scrap reduction. A coherent, cross-functional strategy is required to achieve lasting improvement.
The strategic framework for aerospace scrap reduction aligns around four pillars:
Pillar
Focus
Key Actions
Process Capability
Ensure processes can consistently meet specifications
Capability studies, tooling investment, method optimization
Governance
Maintain configuration control and change discipline
Drawing control, change management, supplier approval
Containment Discipline
Limit scope when nonconformance occurs
Rapid identification, segregation, predefined response protocols
Root Cause Rigor
Prevent recurrence through systemic correction
Data-driven RCA, controlled change implementation, effectiveness verification
A consistent set of metrics enables tracking progress and identifying areas for focus:
- Yield by process step and operation
- Rework hours as a percentage of production hours
- MRB cycle time (days from identification to disposition)
- Concession volume by part family and customer
- Internal failure cost versus external failure cost
Strategic focus should target high-leverage areas: flight-critical assemblies, bottleneck special processes, and chronic nonconformance families. Not all scrap events are equal. A 5% reduction in scrap on a high-value, long-lead titanium forging generates more margin impact than a 20% reduction on low-value standard hardware.
For multi-site organizations, standardizing definitions, codes, and escalation paths across plants is essential to understanding enterprise-level scrap impact. When each site uses different nonconformance codes or different criteria for classifying scrap versus rework, enterprise reporting becomes unreliable. Standardization enables meaningful comparison and the identification of best practices for transfer across sites.
Implications for Aerospace MRO and In-Service Operations
Scrap and nonconformance dynamics differ in MRO environments, where the asset is already in service and turnaround time is critical. The cost structures and time pressures create distinct challenges that require adapted approaches.
The cost of scrapping a repairable unit in MRO extends beyond material value. Unplanned procurement of new hardware extends turnaround time. Extended TAT may trigger AOG events, with operators unable to return aircraft to service. Contract penalties with airlines or operators compound the direct cost. The ripple effects on customer satisfaction and future business can exceed the immediate financial loss.
Repair development, repair station capability, and configuration control of service bulletins and Airworthiness Directives all affect MRO scrap rates. When repair methods are marginal, blending limits are tight, or inspection interpretations vary between shifts, scrap of otherwise serviceable components increases. Consider a CFM56 or LEAP engine shop facing repeated scrap of fan blades due to marginal blending limits and inconsistent inspection interpretations. Each scrapped blade represents both a direct loss and a potential TAT extension.
The same strategic levers apply in MRO: process capability, governance, containment, and root cause rigor. However, timelines are compressed and customer pressures are immediate. Efficient operations depend on having repair methods qualified, inspection criteria clear, and disposition authority delegated to the appropriate level. Delays that might be tolerable in OEM production become unacceptable in MRO, where every day of TAT affects customer operations.

How Connect981 Fits: Unified View of Scrap, Nonconformance, and Operational Risk
The strategic themes in this article require operational implementation. Organizations need visibility into where scrap originates, which processes drive chronic nonconformance, and how containment actions propagate across plants and suppliers.
Connect981 provides a unified operations layer that brings work instructions, nonconformance records, quality inspection data, and supplier interactions into a single view. This unified visibility supports governance, traceability, and root cause analysis by eliminating the fragmentation that characterizes many aerospace operations today. When nonconformance data, process parameters, and supplier lot information exist in disconnected systems, the data-driven RCA required for reducing scrap becomes impractical.
The platform’s focus on aerospace manufacturing and MRO enables consistent handling of serial numbers, configurations, concessions, and inspection history across plants and suppliers. Decision quality improves when leaders can see patterns across the organization rather than relying on site-by-site reporting with inconsistent definitions.
Organizations that want to explore how their current scrap and COPQ picture could be made visible at an enterprise level can request a demo of Connect981.
Conclusion: Treating Scrap as a Managed, Measured Risk
Aerospace scrap reduction is about managing financial and program risk through disciplined processes and governance. Reducing scrap is not a housekeeping exercise or an environmental initiative. It is a margin protection strategy with direct consequences for program performance, customer relationships, and competitive position.
The structural levers are clear: process capability that matches specification requirements, special process control that prevents unverifiable defects, strong NCM governance that accelerates disposition and protects traceability, containment discipline that limits the scope of quality events, and root cause rigor that prevents recurrence.
Future articles in this series will address detailed COPQ modeling methods, advanced root cause analysis techniques for aerospace applications, special process qualification strategies, and AS9100-aligned governance structures. Each topic connects to the framework established here.
For executives, the call to action is straightforward: treat scrap and nonconformance data as core performance indicators, reviewed at the same cadence as schedule adherence and EBITDA. The organizations that achieve operational excellence in aerospace are those that treat cost of poor quality as a strategic variable they intentionally design and govern, not as an unavoidable cost of doing business.
Frequently asked questions
The true cost of poor quality (COPQ) in aerospace manufacturing is the total lifecycle cost of nonconformance, not just scrap and rework. In practice, most plants see only a fraction of this in their standard reports, because much of the cost is hidden in overhead accounts, schedule buffers, and untracked engineering and supplier effort.
Main cost categories of poor quality
At a minimum, COPQ in aerospace typically spans the following categories:
In practice, this connects to scrap and rework reduction when teams need to turn the answer into repeatable execution habits.
- Direct material losses
- Scrap of raw material, forgings, castings, and high-value machined parts
- Lost hardware from damage during assembly, test, handling, or rework
- Obsolescence when design changes are driven by quality issues
- Direct labor for rework and repair
- Rework, repair, and extra inspection labor on the shop floor
- Re-setup time for CNC, special processes, and assembly stations
- Travel work to fix issues at downstream sites, integrators, or customers
- Indirect labor and engineering effort
- MRB (Material Review Board) and disposition time for quality, engineering, stress, and supply chain
- Root cause analysis and CAPA activities, including testing and trials
- Configuration management and documentation updates triggered by quality issues
- Schedule and throughput impacts
- Line stoppages and station blocking while nonconformances are evaluated
- Out-of-station work and resequencing that reduce effective capacity
- Expediting, overtime, and premium freight to recover schedule
- Supplier- and customer-facing costs
- Supplier returns, debit memos, and additional incoming inspection
- Customer concessions, escape investigations, and audit responses
- Field returns (RMA), investigations, and retrofit or modification campaigns
- Test, inspection, and assurance overhead
- Additional inspections, special tests, and repeated acceptance testing
- Extended FAI/PPAP or qualification due to recurring issues
- Increased NDT, CT scanning, or destructive testing to regain confidence
- Regulatory and certification implications
- Certification delays when systemic quality issues trigger re-analysis or re-test
- Extra documentation and traceability work to satisfy authorities or primes
- Increased oversight, surveillance, or required independent inspections
- Long-tail and reputational impacts
- Lost bids or unfavorable contract terms due to perceived quality risk
- Pricing pressure and liquidated damages when delivery performance slips
- Internal risk premiums and design conservatism that add weight and cost
Why most plants underestimate COPQ
In regulated aerospace environments, the reported cost of poor quality is often materially lower than the real impact because of how costs are captured:
- Fragmented systems: Scrap may be tracked in ERP, rework hours in MES, MRB time in a PLM workflow, and customer escapes in a QMS. These rarely reconcile cleanly without deliberate integration and governance.
- Overhead masking: Quality fire-fighting (MRB, investigations, audits) is often treated as salaried overhead rather than tagged to specific nonconformances or part numbers.
- Poor time attribution: Supervisors and technicians seldom code every hour to a specific defect, particularly during line stoppages or urgent recovery.
- Schedule impact not monetized: Delays and resequencing are visible as late orders and WIP growth, but rarely translated into explicit COPQ numbers.
- Supplier and customer effects off-book: Extra meetings, negotiations, and travel related to escapes or supplier issues are often not allocated to quality cost accounts.
Where data is incomplete or inconsistent across plants, any calculated COPQ should be treated as a lower bound, not a full representation of the cost of poor quality.
How to structure COPQ for aerospace programs
Given the complexity and long lifecycle of aerospace programs, many organizations use a structured COPQ model tailored to their environment. A pragmatic starting point is to classify costs into four buckets:
- Internal failure costs
- Scrap, rework, repair, retest
- MRB labor and internal investigations
- Re-inspection and added checks driven by internal defects
- External failure costs
- Customer returns, concessions, and escape investigations
- Warranty, retrofit, and modification campaigns
- Penalties, charge-backs, and special oversight from customers
- Appraisal costs
- Incoming, in-process, and final inspection
- Test equipment calibration and maintenance tied to quality assurance
- Extra audits or surveillance introduced after quality events
- Prevention costs
- Training, PFMEA, control plans, and design for manufacturability efforts
- Process capability studies and pilot runs
- Systems, fixtures, and automation invested in to prevent recurrence
In aerospace, internal and external failure costs often dominate, but appraisal and prevention costs can be substantial due to regulatory and customer requirements. A realistic view requires tracking all four categories, with clear definitions and governance.
Brownfield and long-lifecycle constraints
Most aerospace manufacturers operate in brownfield environments with legacy MES, ERP, PLM, and QMS systems. This creates constraints when quantifying and reducing COPQ:
- System coexistence: Replacing core systems just to improve COPQ visibility is rarely feasible due to validation, downtime, and integration risk. Incremental improvements (better coding of nonconformances, improved data interfaces, standardized MRB workflows) are usually more realistic.
- Traceability expectations: High traceability requirements mean that fixes to quality processes must preserve serial/lot history and genealogy. Quick patches that break traceability can create more risk and cost than they remove.
- Change control burden: Any change to inspection plans, digital work instructions, or automated checks must go through formal change control and, in some cases, customer or regulatory approval. This slows the pace of COPQ reduction and favors targeted, high-impact changes.
- Long program lifecycles: Quality issues discovered in service can trigger costs and engineering effort decades after initial manufacture. COPQ models need to account for long-tail failure modes and retrofit scenarios, not just factory metrics.
Practical steps to estimate the true COPQ
The exact cost will vary by plant, program, and customer base, but a defensible estimate typically involves:
- Defining standard categories and data owners
Agree on what counts as internal failure, external failure, appraisal, and prevention. Assign process owners for each category so ongoing data capture is not ad hoc. - Leveraging existing systems instead of replacing them
Use current ERP, MES, PLM, and QMS to tag nonconformances and related activities with consistent identifiers (part, program, defect code). Small configuration changes and better coding discipline often yield more insight than large system overhauls. - Sampling indirect costs
Where full tracking is impractical, use time studies or representative sampling (for MRB, engineering investigations, travel work) to estimate typical hours per event and extrapolate. - Translating schedule impacts into cost
Work with finance and program management to monetize delays, line stoppages, and out-of-station work using standard cost of capacity, expedite rates, and contractual penalties. - Validating and revising the model
Treat the first COPQ estimate as a working model. Expect gaps due to data quality, legacy systems, and inconsistent coding. Iterate with cross-functional reviews rather than relying on a single system report.
What this means for decision-making
When viewed holistically, the true cost of poor quality in aerospace is typically far higher than what shows up as scrap and rework on monthly dashboards. This affects:
- Business cases: Investments in prevention, process robustness, and better digital traceability often pencil out only when the full COPQ is included, not just direct material savings.
- Prioritization: Not all defects are equal. High-frequency, low-severity defects may be less costly than low-frequency issues that cause escapes, line stops, or retrofit campaigns.
- Risk posture: Explicit COPQ numbers make it easier to justify conservative steps in design, supply chain qualification, and process change control without overstating or understating risk.
Ultimately, the true cost of poor quality is plant- and program-specific. Any estimate must be grounded in how consistently your organization captures nonconformances, hours, and schedule impacts across its existing systems.
Scrap in aerospace manufacturing drives program-level financial risk because it compounds across high unit costs, long lead times, and rigid customer and regulatory requirements. The impact is rarely limited to a single workcenter. It can affect contract margins, schedules, working capital, and even future bid competitiveness.
1. Direct cost of nonconforming parts is amplified at program scale
Scrap directly increases the cost of goods sold for a program. In aerospace, this effect is magnified by:
In practice, this connects to non-conformance management when teams need to turn the answer into repeatable execution habits.
- High material cost: Titanium, nickel alloys, composites, and forgings can represent a large share of unit cost. Scrapping a near-net forging or autoclaved composite part can mean losing most of the material investment.
- Expensive processing routes: Multi-step machining, special processes, NDT, coatings, and outside processing add value that is lost when a part is scrapped late in the routing.
- High inspection and test cost: NDT, dimensional inspection, and qualification testing are expensive; scrapping post-inspection can mean losing substantial nonrecurring effort.
When similar scrap issues repeat over many lots, the program’s effective unit cost can drift significantly above what was assumed in the original business case.
2. Margin erosion against long-term contracts
Many aerospace programs operate under multi-year, fixed-price or price-curve contracts. Scrap that was underestimated at bid stage creates structural margin risk:
- Underquoted COPQ: If scrap and rework rates are higher than modeled, the contract margin erodes. In mature programs with limited repricing options, this is often unrecoverable.
- Volume and learning-curve effects: Scrap can delay or flatten learning curves, preventing the cost reductions assumed in the pricing ramp.
- Customer cost-down commitments: Many contracts include year-over-year price reductions. Persistently high scrap can make these reductions financially unsustainable.
Because aerospace programs run for years, even a few percentage points of unplanned scrap can translate into large cumulative margin loss.
3. Schedule risk, penalties, and recovery cost
Scrap often drives schedule risk, which in aerospace programs has explicit and implicit financial consequences:
- Missed delivery penalties: Contracts may include liquidated damages for late delivery. Scrap on long-lead or critical path parts can trigger these clauses.
- Expediting costs: To recover, plants may pay premiums for expedited material, overtime, additional shifts, or alternative suppliers, raising unit cost.
- Disruption to final assembly: A single scrapped component can hold up an aircraft, engine, or major subassembly, affecting not just your plant but the OEM’s delivery schedule.
The financial impact is often a combination of direct penalties, higher operating expense during recovery, and strained customer relationships that can affect future awards.
4. Working capital and inventory distortions
Persistent scrap drives working capital and inventory issues at program level:
- Excess safety stocks: To offset unpredictable scrap, planners increase buffer stocks of WIP, raw material, or semi-finished parts. This ties up cash and masks process instability.
- Obsolescence risk: Extra inventory built to cover scrap can become obsolete when designs change, configurations shift, or the customer revises demand.
- MRP and capacity plan distortion: If planned scrap factors in ERP or MRP are inaccurate, the system will miscalculate requirements, leading to either shortages or overproduction.
In long-lifecycle aerospace programs, this working capital drag can persist for years if the underlying scrap causes are not addressed.
5. Nonrecurring engineering, qualification, and change costs
When scrap reveals capability or design issues rather than isolated operator error, the remediation can be expensive at program scale:
- Process and equipment changes: Reducing scrap may require new fixturing, tooling, machine upgrades, or process redesign.
- Requalification and validation: In regulated aerospace environments, significant process or equipment changes trigger qualification, validation, or first article efforts. These consume engineering, quality, and certification resources and add nonrecurring cost.
- Documentation and training updates: Changes may require updates to work instructions, control plans, FMEAs, and training, all under change control and configuration management.
These nonrecurring costs are often borne at the program level and may not be recoverable from the customer, especially if the issues are viewed as supplier-controlled.
6. Supplier and outside-processing cost pass-through
Scrap in aerospace programs frequently involves tiered suppliers and outside processors:
- Supplier price increases: If suppliers experience high scrap on your parts, they may increase pricing, add scrap factors, or refuse fixed-price agreements.
- Disputes over responsibility: Determining whether scrap is caused by material, process, or design can lead to delays and friction, tying up teams and affecting continuity of supply.
- Limited alternate sources: Qualified aerospace suppliers and special processors are limited. If one exits due to poor program economics driven by scrap, qualifying a replacement is slow and expensive.
These dynamics raise landed cost and can create systemic supply risk for the program.
7. Quality metrics, audits, and reputational risk
High scrap is often correlated with quality instability, even if nonconforming parts are caught before shipment:
- Audit findings: Excessive scrap may draw regulator or customer attention, increasing the intensity and frequency of audits or assessments.
- Customer confidence: Scrap can undermine customer confidence in your process capability and risk management, influencing source selection on future programs.
- Resource diversion: Engineering and quality teams may be pulled into chronic scrap firefighting, reducing capacity for improvement projects or new program introduction.
While this is not an immediate P&L line item, it is a long-term financial risk to the program and to the broader portfolio.
8. Brownfield constraints that sustain scrap risk
In most aerospace plants, scrap risk is entangled with brownfield realities:
- Mixed legacy systems: Scrap data may be fragmented across MES, ERP, QMS, and spreadsheets, limiting accurate cost attribution at program level.
- Limited downtime for fixes: Older equipment and high utilization make it hard to schedule the process trials or upgrades needed to address root causes.
- Long qualification cycles: Even when a better process is known, changing it may be slowed by qualification and validation requirements, prolonging the period of elevated scrap.
This means high scrap is not always quickly correctable. Financial risk persists while engineering, quality, and operations work through change control and qualification.
9. Managing program-level risk from scrap
Mitigating financial risk from scrap in aerospace requires program-level visibility and disciplined operations, not only local yield projects:
- Quantify scrap by program, part family, and process step using existing ERP, MES, and QMS data, even if integration is imperfect.
- Tie scrap cost to the business case by comparing actual COPQ against contract assumptions and price curves.
- Prioritize high-impact drivers such as long-lead, high-value, or critical path parts where scrap causes schedule or penalty risk.
- Use structured root cause analysis and change control so that improvements remain traceable and support future audits.
- Model scenarios for how persistent scrap would impact margin, inventory, and capacity over the program lifecycle.
The goal is not to eliminate all scrap, which is unrealistic, but to understand and control its financial impact across the life of the program within the constraints of existing systems, qualification requirements, and operating realities.
A 2% yield loss in aerospace does not stay a simple “2%” because it interacts with long cycle times, complex assemblies, and tight regulatory controls. Small losses early in a program often trigger a chain of rework, delays, and secondary effects that multiply the actual impact on cost, schedule, and capacity.
1. Long cycle times amplify small losses
In aerospace, a single build cycle can span weeks or months, with multiple qualified processes and inspections. A 2% yield loss at any of those stages is expensive because:
In practice, this connects to scrap and rework reduction when teams need to turn the answer into repeatable execution habits.
- Each nonconformance ties up high-value work-in-process (WIP) for a long time.
- Rebuilds or replacements must re-enter an already long, capacity-limited flow.
- You may not see the true failure pattern for months, so you keep repeating the same loss before you can react effectively.
Over multi-year production, that 2% becomes a persistent drag on throughput and cost rather than a one-time hit.
2. Yield loss often repeats at multiple levels of assembly
Yield is not a single event. It occurs at:
- Part manufacturing (e.g., machining, composites, additive).
- Subassembly integration.
- Final assembly and test.
- Ground/flight test or acceptance test procedures.
If each level has a “small” loss, they combine. As a simplified example, assume 2% yield loss at three independent stages in a chain:
- Stage A: 98% yield.
- Stage B: 98% of what passed A.
- Stage C: 98% of what passed B.
Overall yield ≈ 0.98 × 0.98 × 0.98 ≈ 94.1%. That is almost a 6% effective loss, not 2%. Real programs often have far more than three critical yield points, and some of them are much more expensive to fail at (for example, late functional or pressure tests).
3. Rework is not free and is constrained by qualification
In regulated aerospace, you generally cannot rework or re-route at will:
- Rework procedures must be defined, qualified, and documented.
- Additional inspections, MRB reviews, and concessions consume expert time.
- Rework may push hardware into the next planning period, missing planned test windows or delivery slots.
Every 2% of nonconforming units creates a queue of rework and paperwork. That queue consumes finite engineering, quality, and MRB capacity, which then slows response to other issues. Over long cycles, this chronic load can crowd out improvement work and drive further yield losses elsewhere.
4. Downstream scrap multiplies the cost base
Scrap late in the build is much more costly than scrap early:
- A failed component after final assembly may embody hundreds or thousands of hours of labor and high-value components.
- Late test failures can force partial disassembly or full rebuild, sometimes writing off entire structures.
- For serialized, safety-critical hardware, some failure modes cannot be reworked at all and must be scrapped even after heavy investment.
So the same 2% physical loss at a late test gate can represent 10–50% of the program’s incremental cost of poor quality, depending on where it hits. Over multiple years, those expensive failures accumulate more than linearly.
5. Schedule and slot impacts cascade across the program
Aerospace programs typically operate against firm slots (test stands, customer deliveries, flight windows, launch manifests). Yield loss can cause:
- Missed integration or test slots, forcing hardware to wait for the next available opportunity.
- Out-of-sequence work and workarounds that add risk and further errors.
- Ripple impacts on other programs sharing the same constrained resources.
Even if the material scrap rate is 2%, the delay and re-planning burden can affect a far larger portion of the build schedule and capacity. Over long cycles, these schedule perturbations layer on top of each other.
6. Learning-curve and improvement slowdowns
Stable, high yield enables predictable learning curves. Persistent low-level yield loss does the opposite:
- Teams spend time firefighting, not systematically improving the process.
- Variability in throughput makes it hard to confirm whether a change actually improved yield.
- Frequent deviations and concessions normalize nonconformance, which can mask emerging issues.
Over programs that run for years, losing a few percentage points of learning-curve improvement every year compounds into large cost and capacity gaps relative to plan.
7. Brownfield realities: constrained options, long lifecycles
In existing aerospace plants with mixed legacy MES, ERP, PLM, and QMS systems, a 2% yield problem is rarely fixed by a clean replacement of systems or processes:
- Key processes are tied to qualified equipment and validated software; changing them triggers requalification, validation, and documentation updates.
- Downtime windows for major process or system changes are limited by delivery obligations and test schedules.
- Integration debt (manual workarounds, spreadsheets, custom scripts) can hide where yield loss is actually occurring.
Because full system replacement is often not feasible in the short term, the same 2% loss can persist across multiple product blocks or variants, effectively compounding in financial terms over the life of the program.
8. Data, traceability, and regulatory overhead
Every nonconformance in aerospace typically requires:
- Traceability checks (materials, special processes, operator qualification).
- Formal documentation (NCRs, MRB records, corrective action reports).
- Change control updates if corrective actions touch procedures, tooling, software, or inspection plans.
When 2% of units fail at one or more steps, the documentation workload can escalate quickly. This slows down both the physical process and the rate at which permanent fixes can be validated and rolled out under proper change control.
9. Financial compounding: cost of poor quality over time
Even if the physical yield loss remains at 2%, the cost impact can grow each year because:
- Labor, material, and overhead rates increase while the loss rate remains.
- Backlog and penalties (liquidated damages, expedite costs, customer recovery actions) may rise as delays accumulate.
- Additional inspection, containment, and redundant checks are layered in to manage perceived risk, adding structural cost.
In financial terms, this is classic compounding of cost of poor quality over a long program life, not just a static 2% hit.
What this depends on
The degree of compounding from a 2% yield loss depends heavily on:
- Where the loss occurs in the build (early part vs final test).
- How reworkable the hardware is under your specifications and approvals.
- Cycle times, queue times, and bottlenecks in your specific line or facility.
- The maturity of your NCR, CAPA, and change control processes.
- The quality and integration of your data across MES, QMS, PLM, and ERP.
Plants with robust, validated data flows and disciplined problem-solving can detect and reduce compounding faster. Plants with fragmented systems and high integration debt tend to experience more severe and persistent amplification from what looks like a “small” yield issue.
Nonconforming material almost always reduces effective capacity and increases schedule risk, even if headline utilization numbers look unchanged. It does this by consuming constrained resources, disrupting flow, and increasing variability in already tight, regulated environments.
Direct impact on capacity
Nonconforming material affects how much compliant product you can produce with the same assets and headcount:
- Rework consumes prime capacity: Operators, machines, test stations, and fixtures are used to rework or re-test instead of producing first-pass good units. On constrained equipment (e.g., special processes, ovens, test stands), rework quickly reduces available capacity for planned orders.
- Scrap drives replacement orders: Scrapped units must often be remade to meet customer or program demand. This adds unplanned load on machining, assembly, and inspection, effectively lowering your true throughput for the period.
- Inspection & MRB time become bottlenecks: In regulated environments, quality engineers, inspectors, and MRB boards must formally disposition nonconformances. When NCM volume is high, these roles become hidden bottlenecks, delaying release of conforming material and tying up WIP.
- Changeovers and setups increase: Extra replacement lots and rework runs cause more starts/stops and product changes. Each additional setup consumes time and introduces further opportunity for error.
- Downstream rework cascades upstream: If nonconformance is detected late (e.g., final test or customer inspection), the recovery plan often pulls upstream resources off planned work to investigate, sort, and rebuild, reducing capacity across multiple operations.
Impact on delivery schedules
Nonconforming material rarely aligns with the production plan. The result is schedule disruption:
- Missed committed dates: When nonconformance is found after materials are allocated and capacity is booked, replacement work competes with existing orders. Unless there is slack, something shifts to the right.
- Longer and less predictable lead times: Every additional inspection, MRB review, rework loop, and retest adds time and variability. Even if average lead time is manageable, the spread between best-case and worst-case grows, complicating customer commitments.
- Expediting and resequencing: To recover from NCM, planners and supervisors often resequence jobs, pull in some orders, and push out others. This local optimization may save a key shipment but tends to degrade overall schedule adherence.
- Knock-on effects across shared resources: In shared facilities, nonconformance in one program can consume capacity required by other programs, causing secondary delays and internal priority conflicts.
Hidden operational and planning effects
Beyond obvious rework and scrap, nonconforming material introduces less visible but significant impacts:
- Inflated WIP and inventory: Holds and quarantines increase apparent WIP and finished goods. A portion of that inventory is not truly shippable, but standard MRP/MES views may not distinguish it cleanly without good status handling.
- Planning accuracy degrades: If nonconformance rates and disposition times are not accurately modeled in planning and MRP parameters, capacity plans and delivery promises become over-optimistic. Schedulers assume capacity that is actually being lost to rework and investigation.
- More variability in flow: NCM spikes create irregular work patterns (sort activities, extra inspections, rework campaigns). This destabilizes takt, increases queues, and makes performance metrics (OEE, NPT, on-time delivery) more volatile.
- Increased administrative load: Engineering, quality, and operations leaders spend more time on investigations, risk assessments, and customer communications instead of improvement work, further limiting the system’s real capacity to improve.
Regulated and brownfield system considerations
In regulated environments, the same nonconformance often consumes more time and capacity than it would in an unregulated plant, because of:
- Formal MRB and documentation: Each nonconformance may require structured MRB, documented risk assessment, customer notification, and traceable approval. This adds queue time and manual work in QMS, MES, and ERP.
- System disconnects: In brownfield stacks, nonconformance data is often split across legacy MES, ERP, QMS, PLM, and spreadsheets. Poor integration slows visibility of what is truly available to ship, which lots are blocked, and where capacity is tied up.
- Validation and change control: Improvements to NCM workflows (e.g., automating holds, routing, or dashboards) can be slow to deploy due to validation and change control requirements. Plants must often live with inefficient processes longer than they would like.
- Long equipment lifecycles: Older qualified equipment may be less capable of real-time detection or automated containment. That pushes detection later in the process, amplifying schedule and capacity impact per defect.
How nonconforming material shows up in capacity metrics
When monitored well, the impact of NCM can be seen in common performance metrics:
- OEE and NPT: Rework and inspection queues reduce effective performance and increase non-productive time (NPT), even if availability appears high.
- COPQ: Internal failure costs (rework, scrap, extra inspection, MRB effort) rise, but these costs often correlate with schedule slippage and firefighting that are not fully quantified.
- Schedule adherence and on-time delivery: Plants with chronic NCM issues typically show good short-term recovery for priority orders, but poor overall adherence because other orders are delayed to absorb the impact.
Practical ways to limit capacity and schedule impact
Reducing NCM rates is the long-term lever, but in many plants you must also actively contain the operational impact:
- Separate and visualize constrained capacity: Make rework and MRB consumption of key resources visible (e.g., hours per week per cell or test stand), so planners and leaders can see true available capacity.
- Prioritize early detection: Shift inspection and error-proofing as far upstream as feasible, within validation and cost constraints, to avoid discovering nonconformance after major value-add steps.
- Standardize NCM workflows: Use consistent, validated workflows across MES/QMS/ERP for holds, disposition, and release, so nonconforming material does not “leak” into schedulable or shippable inventory.
- Feed NCM data into planning: Incorporate realistic scrap and rework factors, MRB cycle times, and yield assumptions into MRP and capacity models. This does not eliminate the impact but makes delivery commitments more credible.
- Protect critical schedules explicitly: Identify priority programs or customers and establish clear rules for how much rework load can preempt planned capacity without jeopardizing key milestones.
Overall, nonconforming material reduces effective capacity, destabilizes schedules, and increases the effort required to maintain commitments, especially in mixed, legacy system environments where traceability and workflow automation are uneven. Managing its impact requires both quality improvement and deliberate integration with planning and scheduling processes.
In aerospace and other regulated industries, the terms scrap, rework, repair, and concession describe distinct ways of handling nonconforming product. They are not interchangeable, and each has different implications for airworthiness, approvals, documentation, and cost reporting.
Scrap
Scrap is product or material that cannot or will not be used as part of a delivered configuration. Typically:
- It does not meet requirements and cannot be brought back into conformity in a technically and economically justified way, or
- It could be reworked or repaired, but the organization decides not to, based on cost, risk, schedule, or customer requirements.
Key characteristics:
- Removed permanently from the production flow and from any airworthy configuration.
- Physically rendered unusable or clearly segregated, then disposed of following internal and regulatory controls.
- Recorded as nonconformance and as scrap in cost-of-poor-quality metrics.
- Usually does not go through design approval, because it will not fly or enter service.
In brownfield environments, scrap tracking is often fragmented across paper travelers, ERP scrap codes, and local spreadsheets, which can distort actual scrap cost if not aligned.
Rework
Rework means processing a nonconforming item so that it fully meets the original, released design definition and specifications.
Key characteristics:
- The end state is indistinguishable from product that never had a nonconformance when compared to the approved design and specification.
- Uses the same or equivalent processes already approved by design (e.g., re-machining within allowed stock, repeating an approved heat treatment, re-assembling to the same drawing).
- Usually handled through standard nonconformance control, with rework instructions documented, controlled, and traceable (e.g., in an NCR, MRB record, or MES nonconformance workflow).
- Does not require a design deviation, because the final configuration equals the baseline design.
If you must introduce a new process, change a critical dimension tolerance, or alter material properties beyond existing allowances, you have likely moved from rework into repair or design change territory.
Repair
Repair means processing a nonconforming item so that it is acceptable for use, but does not fully conform to the original design definition. Instead, it conforms to an approved repair disposition or repair scheme.
Key characteristics:
- Final condition is safe and acceptable, but not identical to the original design (for example, material is blended out of a noncritical area, or a bushing is installed as a permanent corrective feature).
- Requires formal engineering disposition (e.g., MRB engineering, design authority approval, or use of an approved structural repair manual or standard repair scheme).
- May require stress analysis, fatigue assessment, or other justification, especially in aerospace primary structure or critical systems.
- Often creates a “repaired” configuration that must be traceable on the as-built record, including any limitations, inspections, or life restrictions.
In regulated aerospace, repair dispositions usually need higher-level engineering and, in some cases, regulatory or delegated authority approval. The level of rigor depends on part criticality and applicable regulations or customer contracts.
Concession (Deviation/Waiver)
A concession is formal permission from the design or customer authority to accept, ship, or operate an item that does not meet specified requirements, under defined conditions. In some organizations or standards this may be called a deviation or waiver, and the detailed definitions can differ.
Key characteristics:
- The product remains nonconforming to the original specification on at least one point.
- The nonconformance is acknowledged, risk-assessed, and accepted by the responsible design or customer authority for a limited scope (specific parts, serials, or time period).
- Conditions and restrictions may apply (e.g., inspection intervals, limited life, configuration markings, or operational limits).
- Requires strong traceability, because regulators and customers often review concessions closely during audits and investigations.
Concessions are typically used when the cost, schedule impact, or technical risk of rework/repair is high, but engineering analysis shows the deviation does not compromise fitness for intended use or safety margins.
How they relate and why the distinctions matter
The four dispositions are related but not interchangeable:
- Scrap vs rework/repair: Scrap removes the item from service permanently. Rework and repair return the item to use.
- Rework vs repair: Rework restores full compliance with the original design; repair restores acceptable performance under a modified, approved condition.
- Repair vs concession: Repair changes the hardware or processing. A concession formally accepts a deviation that may remain as-is, with or without physical change.
These distinctions affect:
- Regulatory expectations: Authorities and customers expect documented processes for each disposition, especially repair and concession, and may require specific approvals or delegated signatories.
- Traceability and records: Repaired and conceded items need clear traceability in the as-built record, often across multiple systems (ERP, MES, QMS, PLM). In brownfield stacks, this usually involves workarounds and interfaces rather than a single clean workflow.
- Cost of poor quality (COPQ): Mislabeling rework as repair or repair as scrap distorts data on systemic issues and investment decisions.
- Lifecycle impact: Repairs and concessions can carry inspection or life limits. Losing that link when systems change or are upgraded is a common long-term risk.
Dependencies and plant-to-plant variation
The precise boundaries between rework, repair, and concession can vary based on:
- Contractual definitions with OEMs or primes.
- National or regional regulations and the way your design approval or delegated authority is structured.
- Internal procedures in your QMS, including how MRB authority is defined.
- The maturity and integration level of your MES/ERP/PLM/QMS stack.
When updating processes or systems, it is important not to “simplify” these categories into a single nonconformance bucket. In long-lifecycle aerospace programs, losing these distinctions can create major issues years later during incidents, retrofit campaigns, or design changes.
Special processes such as heat treatment and non-destructive testing (NDT) affect scrap rates in two different but related ways:
- They can create or worsen defects that drive scrap (especially heat treatment).
- They often reveal defects late in the route, so each failure carries a high scrap cost (especially NDT).
How heat treatment drives scrap
Heat treatment is both a transformation step and a risk amplifier. It changes material properties and can introduce nonconformances that are difficult or impossible to rework within spec. Typical scrap drivers include:
In practice, this connects to scrap and rework reduction when teams need to turn the answer into repeatable execution habits.
- Distortion and dimensional out-of-tolerance: Warping, growth, or shrinkage can push critical features outside tolerance. This is common for long, thin, or asymmetrical parts and assemblies. Poor fixturing, inconsistent load configuration, or unvalidated recipes increase risk.
- Nonconforming hardness or strength: Incorrect soak time, temperature control issues, quench delay, or furnace uniformity problems can lead to under- or over-hardening. Often this cannot be fully corrected without violating route or specification limits, especially in regulated sectors.
- Microstructural defects: Improper heat treat can cause undesirable phases, grain growth, decarburization, or case depth issues. These are typically caught via metallography or hardness mapping and usually result in full-part scrap.
- Surface and quench-related damage: Cracking, quench burns, scaling, and intergranular attack can convert high-value, nearly finished parts into scrap late in the process.
- Batch effects: A single furnace load, if processed out of spec, can simultaneously scrap a large group of parts. This magnifies the impact of any control or operator error.
The net effect is that heat treatment tends to increase the probability of scrap per part and, when something goes wrong, can drive large batch scrap events. Because it usually happens late in the route, the financial and schedule impact per scrapped part is high.
How NDT influences scrap
NDT (e.g., radiography, ultrasonic testing, penetrant, magnetic particle, eddy current) generally does not create defects, but it does change when and how you see them:
- Late discovery of defects: In many routes, NDT is scheduled near final inspection or post-heat treat. Any defect detected at this point often leads to scrap after significant value has already been added.
- Increased detection sensitivity: A more capable or stricter NDT process will identify defects that previously passed. Apparent scrap rates may rise, even though the underlying process quality is unchanged. This is often misinterpreted as “NDT is causing scrap” when it is actually exposing upstream issues.
- Operator and interpretation variability: Borderline indications and interpretation differences can push parts into scrap instead of rework. Inconsistent techniques, lighting, calibration, and qualification can change the “effective” scrap rate over time.
- Specification creep: Customer or internal demands for tighter acceptance criteria, more coverage, or additional NDT methods can raise the number of nonconforming findings, again shifting apparent scrap rates.
Practically, NDT controls the timing and visibility of scrap. Where NDT is the final gate, it concentrates scrap at the most expensive point in the route and can expose systemic issues in casting, welding, forging, machining, or heat treatment.
Interactions between heat treatment and NDT
The impact of these processes on scrap rates is often coupled:
- Heat treatment makes latent issues visible: Quenching or thermal cycling can open up microcracks or amplify defects formed in upstream steps. NDT after heat treat will then show an apparent spike in defects, even though the root cause lies earlier.
- NDT placement changes where scrap shows up: If NDT is moved earlier (e.g., pre-heat treat), some defective parts are removed before expensive downstream processing. If it is only post-heat treat, the same defects convert into high-cost scrap.
- Feedback loops often break: In brownfield environments, NDT findings are not always tightly linked back to furnace loads, recipes, fixtures, or heat treat equipment conditions. Without that feedback and traceability, the same special-process issues quietly drive repeat scrap.
Key factors that determine actual scrap impact
The true influence of heat treatment and NDT on scrap rates varies significantly by plant, product, and regulatory context. It depends on:
- Process capability and validation: High-capability, well-validated special processes (qualified procedures, equipment, and personnel) typically have lower scrap, but require substantial up-front qualification, periodic requalification, and disciplined change control.
- Fixture and load design: Stable, validated fixturing and load patterns reduce distortion and variability in heat treatment. Poor fixture design can dominate scrap drivers even when furnace controls are nominally in spec.
- Route design and NDT placement: Where NDT sits in the routing directly affects the cost per scrap event. Multiple NDT gates or in-process checks might reduce late scrap but add capacity and cost burdens.
- Integration and data quality: In mixed MES/ERP/QMS environments, the ability to link NDT results, scrap records, and special-process parameters (load, recipe, equipment, operator, calibration status) is often limited. This weakens root cause analysis and slows scrap reduction.
- Rework allowances and specifications: Some heat treat and NDT-related nonconformances can be reworked (e.g., re-heat treat within limits, local repair plus re-test), but regulated sectors often constrain this. The tighter the specification and rework rules, the higher the scrap share.
- Outsourcing vs in-house: External heat treaters or NDT providers add logistics time, queueing, and communication gaps. Scrap can be harder to trace back to specific process conditions without robust data exchange and supplier controls.
Typical scrap patterns in regulated, long-lifecycle environments
In aerospace, defense, medical devices, and similar sectors, several patterns are common:
- Scrap spikes tied to special-process changes: New heat treat recipes, furnace repairs, or NDT technique changes can cause temporary spikes in scrap. Inadequate revalidation and change control make this worse.
- Chronic, low-level special-process scrap: Even well-run operations see a persistent background level of scrap linked to distortion, hardness variation, or NDT indications. Eliminating this entirely is rarely realistic; the focus is on reducing and containing it.
- High-cost late scrap events: A single furnace excursion or systematic NDT mis-setup can affect many high-value parts. Recovery is often limited by specification and certification requirements, so the financial impact is disproportional.
Full replacement of existing heat treat or NDT systems is rarely a quick solution to scrap issues in these environments. New furnaces or NDT platforms typically require significant qualification, correlation, and validation effort, plus downtime and integration risk. Many organizations instead focus on improving recipes, fixturing, calibration, data capture, and feedback loops on their existing assets.
Practical ways to manage scrap from heat treatment and NDT
To influence scrap rates in a controlled way, many plants focus on:
- Improving traceability between part genealogy, furnace loads, recipes, NDT results, and scrap records, even across mixed MES/ERP/QMS and external processors.
- Analyzing scrap by special-process context, not just part number, so that patterns by furnace, operator, shift, or NDT technique become visible.
- Adjusting route design to pull at least some NDT earlier in the process where feasible, balancing cost, capacity, and regulatory constraints.
- Strengthening change control and revalidation for any modifications to heat treat parameters, fixtures, NDT techniques, or acceptance criteria.
- Targeted capability improvements (e.g., better fixturing for distortion-prone parts, refined quench practices, or more consistent NDT setups) driven by structured root cause analysis rather than ad hoc fixes.
The net effect is that special processes themselves may not be the sole root cause of scrap, but they are critical leverage points. Their control, validation, and integration with upstream and downstream steps strongly influence both the quantity of scrap and its timing and cost.
MRB (Material Review Board) cycle time is critical because it connects quality, operations, supply chain, and engineering in one metric. It measures how long it takes to detect, evaluate, decide, and disposition nonconforming material. When that cycle is slow or erratic, it usually reflects deeper issues in operational discipline, system integration, and organizational alignment.
What MRB cycle time actually tells you
MRB cycle time is not just an administrative lag. It is a proxy for how well the organization can respond to quality events without destabilizing production or compromising compliance. Specifically, it indicates:
In practice, this connects to non-conformance management when teams need to turn the answer into repeatable execution habits.
- Speed of risk assessment: How quickly safety, regulatory, and reliability risks are identified, analyzed, and escalated.
- Effectiveness of cross-functional collaboration: How well quality, engineering, operations, and supply chain can converge on a decision.
- Data accessibility: How easily relevant drawings, specs, history, supplier data, and test results can be retrieved with appropriate traceability.
- Decision discipline: The consistency of criteria used for use-as-is, repair, rework, scrap, or return to supplier.
- System maturity: How well QMS, MES, ERP, PLM and document control systems support the MRB process rather than obstruct it.
Operational impacts of long or unstable MRB cycle times
When MRB cycle time is excessive or highly variable, it tends to show up in several operational pain points:
- Hidden WIP and inventory distortion: Nonconforming material often sits in limbo, physically on the floor but logically unusable. This obscures true WIP, inflates inventory, and complicates planning and MRP.
- Schedule and capacity risk: Late MRB decisions can strand work orders, delay builds, and force out-of-sequence work, increasing changeovers and setup waste.
- Firefighting and workarounds: Planners and supervisors may pressure for expedites or informal “pre-decisions,” creating variance from standard process and exposing audit risk.
- Rework loops and re-introduction errors: The longer material is in MRB, the higher the chance of misplacement, mislabeling, or reintroduction to the line without complete, traceable disposition.
- Supplier and customer friction: Slow MRB flow delays supplier feedback and chargebacks, and can ripple into missed customer commitments or late configuration changes.
Quality and compliance signals embedded in MRB cycle time
In regulated environments, MRB cycle time also reflects how robustly you manage traceability and documented decision-making:
- Traceable rationale: Short cycle times with good documentation suggest a mature process with clear acceptance criteria and accessible evidence. Short times with poor documentation are a red flag.
- Consistency of dispositions: Wide variability can indicate inconsistent risk tolerance between MRB members, plants, or shifts, which can be problematic under scrutiny.
- Audit resilience: Long queues, missing signatures, or backdated MRB closures often show up in audits as systemic issues rather than isolated events.
- Linkage to CAPA and root cause: If MRB is used purely for transactional decisions, with no linkage to CAPA or trend analysis, recurring issues will inflate both MRB volume and cycle time.
Why MRB cycle time is a better health metric than raw defect counts
Defect rates and nonconformance counts are important, but they can be misleading on their own. MRB cycle time adds critical context:
- Responsiveness vs. absolute quality: Even high-performing lines will have nonconformances. The question is how quickly and consistently they are handled without compromising safety or specs.
- System performance, not just process yield: MRB touches QMS, MES, ERP, PLM, document control, and sometimes LIMS or SPC. Cycle time reveals how well these systems and teams actually work together.
- Stability over time: Stable, predictable MRB timing supports planning and risk assessment. Volatile MRB timing forces buffers and contingency plans.
Typical drivers of poor MRB cycle time in brownfield environments
In mixed-system, long-lifecycle plants, MRB cycle time is often constrained by factors beyond the MRB team itself:
- Fragmented data sources: Drawings in PLM, routings in MES, supplier info in ERP, inspection data in QMS or spreadsheets, with no single view. Each MRB case becomes a manual data-gathering exercise.
- Manual and paper-heavy workflows: Physical MRB boards, paper tags, and wet signatures introduce delays, especially across shifts or buildings.
- Limited availability of decision-makers: MRB often depends on a few key engineers or quality leaders who are split across programs, plants, or time zones.
- Weak standard work: Ambiguous criteria for what goes to MRB vs what can be dispositioned locally, and no clear SLA targets by risk category.
- Tool replacement attempts: Full replacement of QMS or MES solely to “fix” MRB often stalls due to validation burden, integration complexity, and downtime risk, leaving process issues unresolved.
How to use MRB cycle time as a leading indicator
MRB cycle time becomes most useful when it is treated as a structured, risk-aware metric rather than a single aggregate number:
- Segment by risk and origin: Track MRB time for safety-critical vs cosmetic nonconformances, and by source (internal process, design, supplier). Expect different targets for each.
- Distinguish queue time from value-added time: Separate “waiting for data/decision” from actual evaluation work. Queue time is usually where systemic issues hide.
- Correlate with schedule and inventory impacts: Link MRB cases to affected work orders, customer orders, or lots to quantify how MRB timing influences OTIF, NPT, or COPQ.
- Tie to CAPA and continuous improvement: Persistent long MRB times for certain materials, programs, or suppliers should trigger structured root cause analysis, not just local firefighting.
Improving MRB cycle time without destabilizing the plant
In regulated, brownfield environments, improving MRB cycle time usually requires incremental, validated changes rather than wholesale system replacement:
- Clarify policies and thresholds: Define what must go to MRB vs what can be dispositioned under predefined local authority with clear criteria and documentation.
- Standardize MRB workflows: Document standard work, including required evidence, decision trees, and routing. Align it across sites where practical, while allowing for product-specific differences.
- Integrate data access first: Even light integration or shared views between QMS, MES, and PLM can significantly reduce hunt time for drawings, specs, and history, if properly validated and controlled.
- Define and monitor SLAs: Set target MRB times by risk category and track adherence, with clear escalation paths when cases exceed thresholds.
- Use pilots and phased rollout: Test workflow and integration changes on selected product families or lines before scaling, to manage validation, change control, and training.
When treated as a cross-functional performance metric, MRB cycle time provides a realistic view into the health of your operations, data flows, and decision-making discipline. Improving it sustainably requires attention to process design, system integration, and governance, not just new tools.
Weak configuration control creates systemic nonconformance by allowing uncontrolled changes, inconsistent baselines, and hidden divergence between what is documented, what is built, and what is verified. In regulated manufacturing environments, this does not just cause isolated defects; it gradually pushes the whole system out of specification.
Core mechanisms that drive systemic nonconformance
Several failure modes tend to appear together when configuration control is weak:
- Misaligned design, process, and inspection baselines
Different functions (design, manufacturing engineering, quality, test, suppliers) quietly use different revisions. The drawing, routing, work instructions, NC programs, test procedures, and control plans no longer describe the same configuration, so every “conforming” build is conforming only to a local, inconsistent baseline. - Uncontrolled or poorly documented changes
Changes are made directly in plant systems or on the shop floor without formal change control. There may be no clear linkage between change requests, approvals, risk assessments, validation evidence, and the released configuration. Over time, the as-built product diverges from the as-approved design and process, making nonconformance systemic even when individual steps appear correct. - Obsolete content remaining in use
Old revisions of work instructions, specs, BOMs, and test limits stay in circulation (printouts, local drives, screenshots, offline copies in machines). Operators, programmers, and technicians unknowingly use superseded content. The problem scales with each new change, because no one can reliably prove that obsolete content is fully retired. - Inconsistent configuration across product and equipment
Tooling, fixtures, test stands, and software are not maintained at a controlled configuration level matched to the product revision. You end up with situations such as new parts being run on legacy fixtures or tested with outdated software versions, making every resulting pass/fail decision questionable. - Loss of single source of truth
Multiple, conflicting “truths” emerge across PLM, ERP, MES, QMS, and local spreadsheets. Each team trusts their own system. The practical baseline becomes whatever is easiest to access, not what is formally approved, so nonconformance is baked into daily operations, not just special cases. - Hidden scope of impact
Without clear configuration relationships, the impact of a change or defect cannot be reliably scoped (which lots, serials, or customers are affected). This leads to under-scoped or over-scoped containment and rework. Under-scoping leaves systemic nonconformance in the field; over-scoping wastes capacity and damages delivery performance.
How this shows up in regulated production
In regulated, long-lifecycle environments, weak configuration control tends to have specific systemic effects:
- Nonconformance built into “standard” work
When standard work is based on the wrong or ambiguous configuration, the line produces nonconforming units by design. Operators following instructions correctly still create nonconforming product, because the instructions themselves are out of configuration. - Audit and investigation exposure
Internal and external audits, or significant CAPAs, often uncover that the documented configuration does not match what is actually built or tested. Once discovered, the issue is rarely limited to a single batch. The combination of missing traceability and unclear baselines can force broad assessments, re-inspection, or retroactive justification. - Validation and qualification drift
Processes and equipment are validated against specific configurations. If parameters, software versions, or methods drift without controlled revalidation, the formal validation no longer credibly covers current operations. This can invalidate test data and product acceptance decisions across long time spans. - Inconsistent supplier and internal configurations
If suppliers receive incomplete or mixed configuration data (e.g., drawing rev changes but specification or test requirements lag), they may be “compliant” to what they see while still delivering nonconforming product to your current baseline. Internal receiving and inspection then struggle to detect issues consistently. - CAPA noise and misdirected root cause analysis
Symptoms such as defects, escapes, or test failures are investigated locally without recognizing that the underlying issue is configuration misalignment. This leads to local fixes (operator retraining, more inspection) that do not address the systemic configuration problem, so similar issues recur in different products and lines.
Why configuration issues become systemic in brownfield environments
Brownfield plants with mixed legacy PLM, ERP, MES, QMS, and local tools are especially prone to systemic nonconformance from weak configuration control:
- Multiple partial sources of truth across old and new systems, with no robust master configuration or automated synchronization.
- Manual handoffs (e.g., PDFs, spreadsheets, email) that bypass formal configuration and change workflows.
- Long equipment lifecycles where machines embed parameters, offsets, and programs that outlive several document or product revisions.
- Limited downtime for reconfiguring systems and revalidating integrations, which encourages workarounds outside controlled change.
In this context, complete system replacement to “fix” configuration is often unrealistic because of validation cost, downtime risk, and integration complexity. Strengthening configuration control usually has to work with existing systems, creating clear ownership of the baseline and tightening interfaces, rather than assuming a clean-slate platform.
Typical pathways from weak control to systemic nonconformance
Several recurring patterns explain how localized control gaps become systemic:
- Silent divergence over time
Small, undocumented changes (parameter tweaks, local clarifications, supplier substitutions) accumulate. Each seems low-risk in isolation, but over months or years they add up to a configuration that is materially different from what was validated and approved. - Nonconforming but stable operations
Processes may run with low scrap and good throughput even while out of configuration. Because performance is acceptable, the underlying nonconformance is not obvious. It only appears when a new change, a customer complaint, or an audit forces deeper comparison to the intended baseline. - Inadequate configuration traceability in NC and CAPA records
Nonconformances and CAPAs may not reliably capture which configuration (document revisions, software versions, tooling IDs) was in effect. Trends are then analyzed without configuration context, hiding systemic patterns tied to specific versions or uncontrolled changes. - Re-use without re-qualification
Processes, programs, or fixtures validated for one configuration are re-used for derivatives or new options without formal assessment. The assumption of “close enough” spreads configuration risk to multiple product families.
Practical signals that configuration control is driving systemic issues
Leaders should treat the following as warning signs of systemic nonconformance risk from configuration weaknesses:
- Frequent use of printed or locally saved instructions marked up by hand.
- Operators or technicians choosing between multiple versions of documents or programs.
- Disagreement between PLM, ERP, and MES BOMs or routings during investigations.
- NC/CAPA investigations that cannot confidently state which revision was in use.
- Difficulty answering which serials/batches were built under a specific configuration.
- Late discovery that tooling, gauges, or test software were not updated with product changes.
Risk reduction approaches (without implying guarantees)
While there is no single solution and effectiveness depends on system integration, data quality, and process discipline, plants commonly reduce systemic nonconformance from configuration weaknesses by:
- Clarifying configuration ownership for product, process, equipment, and software, with explicit baselines and approval paths.
- Strengthening change control to ensure that any change triggering configuration impact (design, spec, test, routing, software, fixture) links to risk assessment, validation, and documented release.
- Enforcing one operational source of truth for shop-floor instructions and programs, with strict controls on printing, local copies, and point-of-use access.
- Making configuration visible in NC/CAPA so investigations routinely capture and analyze involved revisions and versions.
- Incrementally improving system interoperability (e.g., between PLM and MES/ERP) to reduce manual transcription and syncing of configuration data, rather than attempting immediate full replacement.
Without these controls, even well-intentioned local optimizations can create plant-wide, systemic nonconformance that is difficult to detect and expensive to repair once discovered.
At the executive level, cost of poor quality (COPQ) must connect directly to financials, program risk, and capacity, not just defect counts. That requires disciplined definitions, reliable data sources, and controlled reporting structures that can survive audits and leadership changes.
Start with a finance-aligned COPQ structure
Executives care about how quality issues affect margins, cash, and program risk. A practical COPQ structure in aerospace typically groups cost into a handful of stable buckets:
- Internal failure costs: scrap, rework, reinspection, MRB disposition effort, re-certification, extra NDT, unplanned overtime due to defects.
- External failure costs: returns, concessions, warranty work, service bulletins, field retrofits, customer chargebacks, penalties, liquidated damages.
- Appraisal & containment costs: extra inspection, temporary sort, layered process audits triggered by issues, additional test cycles driven by defects or escapes.
- Systemic & prevention investments: corrective actions, process requalification, tooling rework, supplier development, training explicitly tied to CAPA or risk reduction.
These buckets should be developed jointly by finance, quality, operations, and program management so that COPQ reporting ties cleanly into the P&L and program cost baselines. If finance does not recognize the COPQ numbers, executives will discount them.
Define what is in and out of COPQ
In regulated aerospace environments, arguments about what “counts” can destroy credibility. Before scaling reporting, document:
- In-scope examples: rework hours booked to specific NCs, scrapped hardware with traceable lot/serial, customer returns with RMA numbers, penalty invoices, field retrofit campaigns.
- Out-of-scope examples: baseline qualification testing, planned inspection for regulatory compliance, planned training, and standard overhead that would exist even with zero defects.
- Allocation rules for shared work: e.g., MRB engineer time tagged to NCs vs generic engineering support.
- Capital vs expense: how you treat new fixtures, test equipment, or software purchased in response to quality problems.
Treat these definitions like controlled documents, with revision history and sign-off from finance, quality, and operations. Changing them without governance will break trend analysis and damage trust.
Use a small executive metric set
Executives do not need every detail. They need a stable metric set with clear interpretation and traceable drill-down. A common pattern is:
- Total COPQ as % of revenue (or % of program sales), trended.
- Internal vs external failure split, as % of COPQ and as absolute values.
- Top 3–5 COPQ drivers by cost (e.g., scrap on process family, major customers, key programs, or major suppliers).
- Structural indicators: e.g., rework hours as % of total direct labor, MRB backlog, rate of new significant nonconformances.
These should be consistent across business units whenever possible, even if the underlying processes, systems, and product mixes differ.
Anchor COPQ in traceable data sources
In brownfield aerospace operations, COPQ data usually lives across MES, ERP, PLM, QMS, and point tools. Executive reporting should be explicit about where numbers come from and where they are incomplete. Typical sources include:
- ERP: scrap value, write-offs, rework labor bookings, debits/credits, customer penalties.
- MES / shop-floor systems: defect codes, rework cycles, work-center-level rework hours, re-inspection activity.
- QMS / NC & CAPA system: nonconformance counts and severities, MRB outcomes, escape events.
- Field / service systems: warranty claims, service bulletins, retrofit campaign costs.
- Timekeeping / labor systems: MRB time, quality engineering time, inspection overtime tied to events.
Do not claim COPQ is “comprehensive” if you are only capturing what flows through one system. Instead, clearly label coverage (for example, “current COPQ view includes internal scrap and rework in machining and assembly; external field costs not yet integrated”).
Show trend, not just a single COPQ number
A single COPQ figure for a year or quarter is of limited value. Executives need to see:
- Trends over time: 12–24 months minimum, by total COPQ and by key buckets.
- Mix shifts: internal vs external failures, by program, by facility, by supplier tier.
- Change events: major new programs, production ramp-ups, transfers, system go-lives, or regulatory findings that affect comparability.
Mark on the timeline where you changed definitions, integrated a new system, or closed a major CAPA. This is critical context when interpreting apparent improvements or regressions.
Link COPQ to programs, customers, and constraints
In aerospace, COPQ is as much a program and customer issue as a plant issue. Executive reporting should:
- Break out major programs and customers: show which programs carry disproportionate COPQ and why (HTOL, new technology, immature supply chain, qualification churn).
- Highlight contractual exposure: damages, concessions, and reliability metrics where poor quality translates quickly into cash or reputation risk.
- Connect to capacity and schedule: show rework and MRB time as a constraint on rate, not just a cost line. Executives need to see where quality is limiting deliveries.
Avoid “blame charts” focused on a single plant or supplier without acknowledging design complexity, qualification requirements, and customer-driven changes that drive COPQ.
Explain what you are doing about it
COPQ at the executive level must be tied to meaningful action, not just monitoring. Each reporting cycle should connect:
- Top cost drivers to specific CAPAs, process improvements, or supplier interventions.
- Expected vs realized impact of major actions: what COPQ components you expect to move, by when, and what has actually moved.
- Residual risk: where you expect COPQ to stay elevated due to design maturity, customer change tempo, or upcoming regulatory changes.
Be explicit when actions are constrained by regulatory validation, required requalification, long tooling lead times, or customer sign-offs. Executives need to see which levers are realistically available.
Be honest about measurement limits and brownfield realities
Most aerospace organizations cannot calculate a perfect, all-in COPQ number because of:
- Fragmented systems: multiple ERPs, legacy MES, local Access/Excel tools, manual logs, and disconnected QMS instances.
- Poor historic tagging: labor and material not consistently booked against NCs or CAPAs.
- Long product lifecycles: field costs appear years after production, and attribution to original causes is often partial.
At the executive level, it is better to present a clearly bounded view (for example, “these figures cover 80% of revenue and internal failures only”) than to inflate numbers based on aggressive estimates. Overstated or opaque COPQ undermines both credibility and decision-making.
How to phase in COPQ reporting without a full system replacement
Trying to build “perfect COPQ” by replacing ERP, MES, or QMS in one move is usually unrealistic in regulated aerospace. Qualification burden, validation cost, downtime risk, and integration complexity make big-bang replacement strategies high risk and slow.
A more workable approach for executive-level COPQ reporting is:
- Pilot on a critical value stream: choose one plant or program where data is reasonably structured; define COPQ categories and extraction methods there first.
- Stabilize definitions: get finance and quality to sign off on what counts, how you value scrap, how you book rework, and how you treat shared engineering/QA time.
- Integrate minimally: start with controlled extracts or interfaces from existing ERP/MES/QMS rather than replacing them. Validate every transformation step.
- Scale by pattern, not by system: reuse the metric structure and data mapping logic across sites and systems, accepting some local variation where legacy constraints are immovable.
This keeps COPQ reporting aligned with existing validated systems and change-control practices, rather than introducing a parallel shadow stack that cannot withstand audit or certification scrutiny.
What executives should ask when reviewing COPQ
To keep measurement and reporting rigorous, aerospace leaders can consistently ask:
- Which systems and plants are included and excluded in these COPQ numbers?
- How do these numbers tie to our financial statements and program baselines?
- What changed in definitions or data sources this period compared with last?
- What 3–5 structural drivers are responsible for most of this COPQ, and what is the concrete plan and timeline to address them?
- Where are we constrained by regulation, qualification, or customer approvals in reducing COPQ quickly?
Consistently using these questions helps keep COPQ reporting grounded in traceable facts, realistic levers, and the actual constraints of aerospace production.
Root cause rigor is one of the few levers you can directly control to limit recurring scrap on flight-critical components. It does not eliminate risk, but it materially reduces the probability that the same defect mechanism silently reappears in production.
Why rigor matters more for flight-critical parts
For flight-critical hardware, recurring scrap is not just a cost issue. It threatens:
- Configuration control: Rework and remakes increase the risk that nonconforming parts slip through or that the as-built state diverges from the as-designed state.
- Process validity: Recurrent defects can indicate that a previously qualified/validated process is no longer operating within its proven envelope.
- Traceability integrity: Frequent scrap and rework create complex histories that must remain traceable for audits and investigations.
Without disciplined root cause analysis, you may see short-term scrap reductions from local fixes, but the same failure modes will tend to recur under different conditions, lots, or shifts.
What “root cause rigor” actually means in practice
Rigor is less about the specific tool and more about how completely and objectively you connect evidence to a causal chain. In a typical brownfield aerospace environment, that usually implies:
- Clear, bounded problem definition using actual defect data (e.g., specific features, machines, shifts, programs, tooling, and material lots).
- Structured causality methods (5 Whys, fishbone, fault tree, or similar) applied to converge on a specific, verifiable mechanism rather than generic contributors like “operator error” or “training.”
- Evidence-based hypotheses supported by inspection data, equipment logs, NC programs, gage R&R results, and material certs, not opinion or memory.
- Separation of root cause, contributing causes, and escape causes so you can address both defect creation and why it was not detected earlier.
- Defined verification tests (e.g., capability runs, targeted first article checks, short-term SPC) that prove the suspected cause and confirm the corrective action.
In regulated environments, this rigor must also be documented and traceable into your CAPA or NC system so that an auditor or customer can follow the reasoning and evidence.
How rigorous root cause work prevents recurring scrap
Done well, root cause rigor attacks recurring scrap through several specific mechanisms:
- Disentangling symptom from mechanism: For example, a recurring out-of-tolerance bore on a flight-control component might look like a gaging issue. Rigor often shows the real mechanism is thermal drift on a specific spindle combined with an outdated tool offset practice. Fixing only the gage does nothing to prevent recurrence.
- Forcing system-level thinking: On complex parts routed across CNCs, special processes, and outside processors, recurrence often comes from interfaces — handoffs, data translation, revision mismatches. Structured analysis exposes these cross-boundary causes.
- Driving targeted controls instead of blanket reactions: Instead of “tighten all tolerances and inspect more,” rigor yields specific interventions (e.g., add in-process probe check on a critical feature, lock a machine parameter, update a nesting rule) that are more effective and less disruptive.
- Enabling real learning: Documented causal chains, linked to part numbers, machines, and processes, feed future design-for-manufacturability reviews and risk assessments, reducing the chance of building the same failure mode into new programs.
Typical failure modes when rigor is weak
In plants with recurring scrap on flight-critical components, the problem is rarely the absence of an RCA form; it is inconsistent rigor. Common failure modes include:
- Over-general root causes: Labels like “operator error,” “carelessness,” or “lack of training” that do not identify a specific mechanism you can design out or control.
- No linkage to process change: A root cause is identified, but corrective actions do not modify actual work instructions, NC programs, fixtures, or control plans.
- Bypassing change control: Production implements a quick fix on the machine or router, but it is not captured in the formal change process, so the same issue returns on the next revision, machine, or site.
- Poor integration with legacy systems: CAPA is logged in one system, process data is in another, and machine or CMM logs are offline or hard to query. Analysts rely on recollection rather than data, degrading the quality of causal reasoning.
- No verification of effectiveness: Actions are closed based on completion, not on demonstrated defect reduction over a defined number of lots, cycles, or calendar time.
These weaknesses allow the same mechanisms to reemerge when volume changes, a new shift starts, a new supplier is onboarded, or a similar part is introduced.
Interaction with brownfield systems and long equipment lifecycles
In a mixed-vendor, long-lifecycle environment, root cause rigor has to be designed to work with what you already have, not assume greenfield tools:
- Multiple data sources: Critical evidence may live in MES, ERP, QMS/CAPA, machine controllers, stand-alone CMM software, and paper routers. Rigor requires a practical way to compile and reconcile these for analysis.
- Old but qualified equipment: You often cannot replace legacy CNCs, special process lines, or gaging systems without triggering requalification and downtime you cannot afford. Rigor focuses on adjustments and controls within the existing validated envelope rather than wholesale replacement.
- Incremental, not big-bang, improvements: Attempts to solve scrap by replacing entire MES or QMS stacks frequently stall under validation burden and integration risk. A more resilient approach is to strengthen root cause practices and data flows within the current systems, then incrementally automate and standardize.
In this context, root cause rigor is a realistic and relatively low-disruption lever for reducing recurring scrap compared with major system replacements that may not materially address the true failure mechanisms.
Practical elements of a rigorous approach for flight-critical scrap
For flight-critical components, organizations that effectively prevent recurrence usually have:
- Trigger thresholds for when full root cause analysis is mandatory (e.g., any nonconformance on flight safety parts, repeat nonconformance on the same feature, scrap above a defined COPQ threshold).
- Standardized analysis methods (e.g., mandated 5 Whys and fishbone for certain severity levels) with clear expectations on evidence collection and documentation.
- Cross-functional participation including manufacturing engineering, quality, production, and, when needed, design and supplier quality.
- Formal linkage into change control so that corrective actions affecting processes, software, tooling, or inspection are implemented via controlled, traceable changes.
- Effectiveness checks defined upfront (what metric, how long, what sample size) and reviewed before a CAPA is closed.
- Knowledge reuse by indexing past RCAs by part family, process, machine, and defect type to avoid rediscovering the same root causes on new programs.
Limitations and dependencies
Even rigorous root cause analysis cannot guarantee zero recurring scrap on flight-critical parts. Its impact depends heavily on:
- Data quality and availability from inspection, machines, and supporting systems.
- Organizational discipline in following through on change control, verification, and documentation.
- Process maturity, including how well basic practices (setup, calibration, maintenance, training) are already controlled.
Where these foundations are weak, improving them may have as much impact on recurring scrap as enhancing the analysis techniques themselves.
In summary, root cause rigor does not remove all risk, but for flight-critical components it is a central mechanism for converting isolated defects into durable learning and systematically shrinking the space for recurring scrap.