Manufacturing KPI Dashboard Software: Turning Aerospace Operations Data into Action
Introduction: Why Manufacturing KPI Dashboards Matter in 2026In 2026, aerospace and defense manufacturers sit on more production data than ever before, yet many manufacturers struggle to turn that data into confident decisions. Spreadsheets get emailed between departments. MES screens show one version of cycle time. ERP spits out another. A quality engineer pulls first pass…
Introduction: Why Manufacturing KPI Dashboards Matter in 2026
In 2026, aerospace and defense manufacturers sit on more production data than ever before, yet many manufacturers struggle to turn that data into confident decisions. Spreadsheets get emailed between departments. MES screens show one version of cycle time. ERP spits out another. A quality engineer pulls first pass yield from a local database while the plant manager cites a different number in a customer review. Manufacturers can lose up to $50 billion annually due to downtime alone, and much of that loss traces back to decisions made on stale or conflicting numbers.
The problem is not a lack of data. It is a lack of governed, connected, role-based manufacturing kpi dashboard software that standardizes key metrics like overall equipment effectiveness, first pass yield, scrap rates, and cycle time across teams. Manufacturing dashboards provide real-time visibility into production data, but only when built on a foundation of consistent definitions and unified sources.
Connect 981 is a KPI and analytics platform built specifically for aerospace, MRO, and advanced manufacturing teams who need traceable, reliable dashboards rather than generic BI. It governs KPI definitions, connects existing systems, and turns analytics into practical actions on the shop floor.
This article covers:
- Why spreadsheets and disconnected data create reporting drift
- What manufacturing kpi dashboard software actually is and how it works
- The key performance indicators every aerospace operation should track
- How to design effective dashboards for operators, engineers, and executives
- How Connect 981 helps teams standardize, connect, and act on their data
- Practical examples, implementation advice, and evaluation criteria
From Spreadsheets to Manufacturing KPI Dashboards: The Core Problem
Picture this: an aerospace machining plant misses a delivery window on a titanium engine component. Operations says OEE was on target. Quality reports first pass yield was fine. But when the program manager digs in, they discover that OEE was calculated differently in the MES than in the weekly Excel report, and FPY excluded rework that was quietly handled on the night shift. Manual data collection across disconnected systems created two truths and zero accountability.
This is reporting drift, and it is endemic in manufacturing operations that rely on traditional methods.
Common symptoms include:
- Mismatched definitions for first pass yield across quality and production teams
- Inconsistent cycle time calculations per cell or line
- Incomplete inventory management data that hides material constraints
- Missing supplier performance signals because QMS and ERP are not connected
- Human error in manual data entry corrupting weekly roll-ups
- Power BI dashboards built by one analyst with hard-coded filters that no one else understands
Generic manufacturing dashboards or one-off BI models fail on the factory floor because they have no governance, no standard KPI library, and no direct connection to execution workflows.
What Is Manufacturing KPI Dashboard Software?
Manufacturing KPI dashboard software is a governed layer that connects production, quality, maintenance, supply chain, and commercial data into role-based digital dashboards. It goes beyond visualization. Manufacturing KPI dashboard software consolidates production quality and maintenance data into actionable insights by embedding KPI definitions, data governance, alerting, and workflows that trigger actions.
It centralizes key metrics in one view, providing a broad overview of critical health metrics across the operation. Automated data unification removes the need for manual data entry and analysis, while real-time data integration connects directly to ERP systems, IoT sensors, and shop-floor machinery.
What makes it different from generic BI tools:
- Pre-modeled manufacturing analytics concepts (OEE, cycle time, takt time, FPY, scrap) with governed formulas
- Built-in handling of shifts, lines, part numbers, and serial numbers
- Support for real time and near-real-time updates
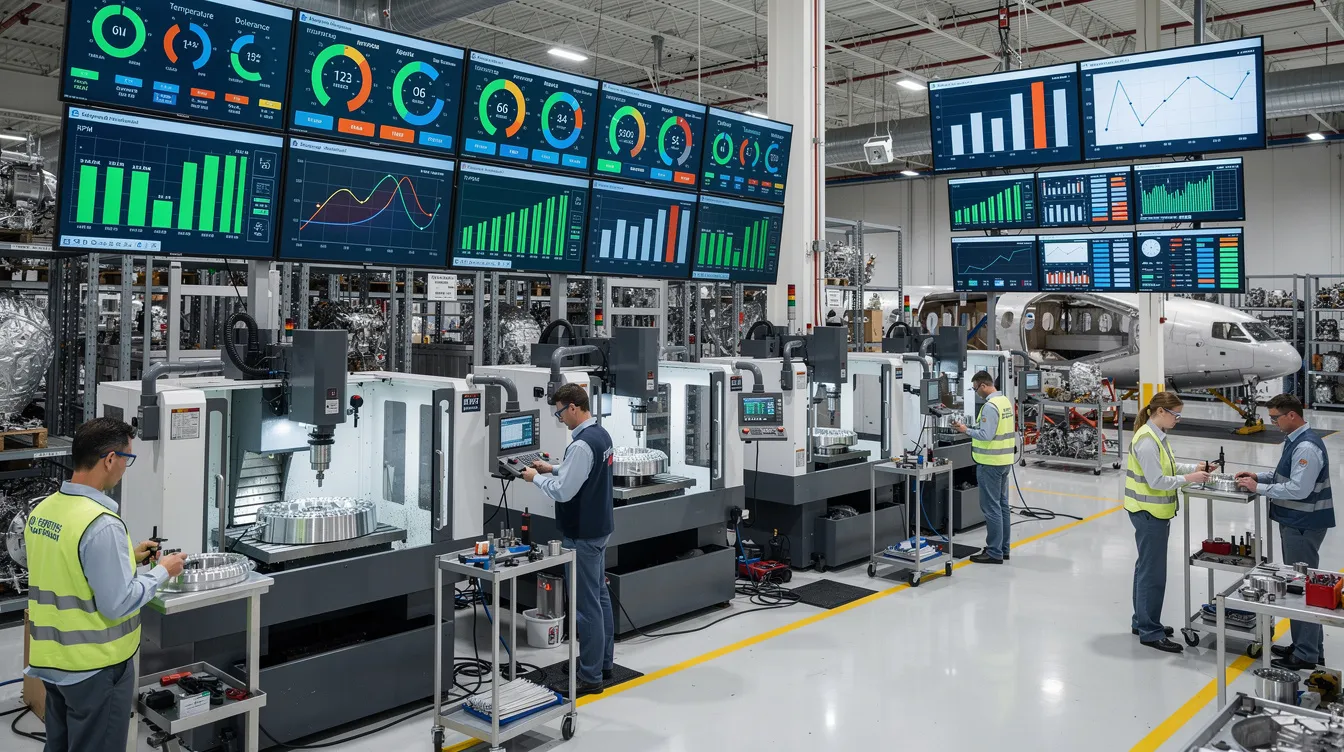
- Interactive data visualization that transforms raw numbers into intuitive charts, color-coded gauges, and status indicators
Typical systems it touches: ERP (orders, cost), MES (work orders, machine status), QMS (nonconformances), CMMS (maintenance events), PLM (revision control), CRM, GA4, Google Ads, and Google Search Console for end-to-end visibility. Dashboards act as a central control tower for the production floor, driving operational efficiency from receiving dock to customer shipment.
Key Metrics to Track in Manufacturing KPI Dashboards
Every serious manufacturing analytics software platform should support these key metrics out of the box, each tied to a data source, a standard formula, and an owner. This prevents the conflicting numbers that erode trust in data driven decisions.
Production and Equipment KPIs
Overall equipment effectiveness is the foundational metric for any manufacturing dashboard. OEE combines availability, performance, and quality into a single score. OEE rates typically fall between 40% to 60% in most discrete manufacturing environments. Highly efficient factories aim for an OEE score of 85%. In aerospace, starting points of 50-65% are common due to long changeovers and qualification runs.
Cycle time measures the duration to transform raw materials into finished products. Tracking true cycle time per part family, including setup and micro-stoppages, through trend lines and distribution charts helps identify bottlenecks that static reports miss. Optimized throughput involves monitoring cycle time and throughput to identify bottlenecks in real time, comparing actual production volume against takt targets per station.
Mean time between failures and mean time to repair are critical for high-value production equipment like autoclaves, NDT systems, and engine test stands. Predictive maintenance allows teams to predict and resolve equipment failures before unplanned downtime occurs. AI enhances predictive maintenance strategies in manufacturing operations by detecting patterns in machine data that precede failures. Predictive analytics reduces unplanned downtime by anticipating equipment failures before they happen. Real-time dashboards help identify bottlenecks quickly, and tracking machine downtime and scrap rates instantly helps optimize resources for reduced downtime and increased yield.
Quality and Yield KPIs
First-pass yield measures the number of quality goods produced without rework or scrap on the first attempt. In aerospace, FPY matters at every critical operation because downstream rework carries enormous cost and schedule penalties. FPY trend charts by program, part number, and supplier lot are essential for continuous improvement.
The scrap rate indicates the percentage of materials that cannot be recycled or recovered, while rework rate captures recoverable but costly defects. Separating these in stacked bar charts by line, shift, and failure mode drives better cost modeling and root cause analysis.
Defect per million opportunities measures product quality at a granular level. Companies with a DPMO of 3.4 have efficient production processes, representing Six Sigma performance. AS9100 is a key standard for aerospace quality management, and quality dashboards track defect rates and production quality metrics required for NADCAP and customer audits. Zero Defect Manufacturing supports quality assurance in aerospace, pushing teams toward process controls rather than inspection-based quality.
The customer reject rate reflects the percentage of products returned by customers. Enhanced quality control helps teams trace issues back to their root cause by monitoring defect rates over time, linking field returns to production batches, lots, and serial numbers.
Inventory, Supply Chain, and Delivery KPIs
Inventory turnover and days of supply expose slow-moving inventory, excess WIP, and material constraints common with long-lead aerospace components. Manufacturers can optimize inventory using predictive analytics insights that flag replenishment needs before stockouts occur.
Supplier quality and OTIF scorecards consolidate defect rate, late delivery percentage, and line-stoppage impact by vendor. Predictive analytics helps identify bottlenecks in production processes caused by supplier delays, giving supply chains early warning. Red-flag tiles for critical part shortages help MRO and production teams prioritize procurement for upcoming work orders.
Schedule adherence dashboards compare committed versus actual lead times for assemblies and MRO events, with visual slip timelines that make delays obvious.
Commercial, Sales, and Website Performance KPIs
Aerospace and advanced manufacturers increasingly need a single manufacturing kpi dashboard that ties operational performance to demand signals and revenue health. Lead volume and lead quality from GA4, Google Ads, and Google Search Console show website visits, form submissions, and search impressions relevant to new program captures. Sales pipeline health from CRM, shown by stage (RFQ, proposal, negotiation, award) and win-rate trends, aligns capacity planning with OEE data.
Performance tracking by tracking specific KPIs can improve speed, quality, and flexibility across the business. Enhanced visibility and accountability improves transparency for specific targets like production output per hour, linking what happens on the shop floor to what the customer experiences.
How Manufacturing KPI Dashboard Software Works Under the Hood
The architecture behind effective kpi dashboards follows a layered approach:
- Data ingestion: connectors pull from ERP, MES, QMS, CMMS, PLM, CRM, GA4, Google Business Profile, and other sources. Aerospace metrics dashboards integrate ERP, MES, and QMS data into a unified stream. Digital dashboards connect shop floor processes to backend systems without requiring a full platform replacement.
- Governed semantic layer: one shared definition for OEE, FPY, cycle time, and OTIF used everywhere. Changes are versioned and documented. Data integration reduces manual work and errors in manufacturing by enforcing consistency.
- Visualization engine: role-based manufacturing dashboards generated for operators, supervisors, quality managers, supply chain, sales, and executives. Real-time data insights improve decision-making in manufacturing by presenting relevant information at the right cadence.
- Workflow and alerting: automated alerting and reporting sends automatic alerts when KPIs fall below predefined thresholds, triggering corrective action workflows.
Key architectural considerations for aerospace:
- Latency: operators need updates every 1-5 minutes; supervisors per shift; executives daily or weekly
- Historical data analysis and trending features allow comparison of current performance against past performance
- Drill-down capability allows users to explore high-level aggregate data for specific granular details
- Customization and scalability allow dashboards to be tailored to specific evolving business processes
- Audit trails log every KPI change, definition update, and threshold breach for AS9100 and FAA compliance
- Automated reporting reduces manual work and errors in manufacturing reporting cycles
Designing Effective Manufacturing Dashboards for Different Roles
The same manufacturing kpi dashboard software must present different windows for different job roles, all drawing from the same governed data model. Layout density, refresh rate, and information scope change depending on whether someone is at the machine, in a daily standup, or in a quarterly review.
Operators and Cell Supervisors
Near real time manufacturing dashboards at the line show big-number tiles for OEE, FPY, current cycle time versus target, and active alarms. These use minimal navigation, large fonts, and color-coding for pass/fail. Real-time data access allows operators to identify and resolve issues instantly. Action buttons like “log defect” or “request maintenance” trigger workflows directly from the dashboard. Operators see only the KPIs they directly influence per shift.
Customizable role-based views allow different stakeholders to see relevant data for their roles without being overwhelmed by information meant for other teams.
Manufacturing Engineers, Quality, and Continuous Improvement Teams
These dashboards feature deeper trend lines, control charts, and Pareto analyses of downtime, scrap, and first pass yield by cell, program, and part revision. Dashboards help identify bottlenecks and improve operational efficiency through filters and drill-downs from factory-level OEE to individual machine cycles. Real-time data from dashboards supports data driven decision making for process improvement initiatives like root cause analysis for chronic defects and correlating cycle time variation with defect spikes.
Plant Managers, Program Managers, and Executives
Control-tower manufacturing dashboards aggregate multiple plants, suppliers, and programs with KPIs for delivery, quality, cost, and safety. Automated dashboards display KPIs transparently across the organization to improve accountability. Data-driven accountability aligns operators and executives around common goals through shared performance metrics.
Executives need fewer metrics but stronger storytelling: at most 10-15 top KPIs with red/amber/green status and drill-through to root causes. Cross-domain tiles place on-time delivery next to website lead volume, sales pipeline, and supplier performance to link strategy with operations. Dashboards can be customized for different user roles and needs.

Why Generic Dashboards and BI Tools Aren’t Enough for Aerospace Manufacturing
Tools like power bi, Tableau, or generic kpi dashboards excel at visualization but require heavy modeling and governance work that most plants never finish. Manufacturing dashboards integrate data from machines and sensors, but generic tools lack built-in awareness of shifts, routings, serial numbers, quality states, and regulated documentation.
Common limitations:
- Hard-coded measures that drift over time as data analysts leave or change roles
- One-off dashboards per department with no unified KPI catalog
- No trigger or alert workflows; dashboards remain passive displays
- Weak traceability back to specific work orders or serial numbers
When two teams present different FPY numbers to a customer or auditor because they used different filters in separate BI reports, the credibility damage is immediate and lasting.
Specialized manufacturing analytics software platforms like Connect 981 close this gap by embedding KPI governance, operational context, and workflow into the dashboard layer.
How Connect 981 Supports Manufacturing KPI Dashboards
Connect 981 is a unified operations and analytics layer for aerospace manufacturing and MRO that governs KPIs across production, quality, supply chain, and commercial teams. Manufacturing dashboards provide real-time visibility across operations by connecting to existing systems at a governed layer without forcing a rip-and-replace of legacy infrastructure.
The platform is built around aerospace realities: digital work instructions, parts traceability, serial number management, inspection workflows, and AS9100, FAA, and EASA audit readiness. Real-time data from predictive analytics improves decision-making speed across every level of the organization.
Governed KPI Definitions Across Operations
Connect 981 centralizes KPI definitions for OEE, FPY, cycle time, scrap rate, OTIF, inventory turns, and more in a shared catalog. Changes to formulas are versioned, documented, and applied consistently across all manufacturing dashboards and kpi reports. During audits and customer reviews, teams demonstrate exactly how pass yield or defect rates are calculated for a given period. This governance eliminates reporting drift where each department builds its own spreadsheet logic for the same metric.
Connecting Data Sources Without Rebuilding Your Stack
Connect 981 sits above existing systems, pulling data from ERP (orders, BOMs, costs), MES (work orders, machine performance), QMS (NCs, CAPAs), CMMS (maintenance events), and commercial tools (CRM, GA4, Google Ads exports). The platform normalizes identifiers like work order numbers, part numbers, serial numbers, and supplier codes so KPIs span systems seamlessly. Integration is configurable with minimal IT overhead compared to full MES replacement projects.
Role-Based Manufacturing Dashboards and Templates
Connect 981 provides template dashboards for common aerospace roles: operator line boards, quality dashboards, supplier scorecards, plant-wide OEE views, and executive control towers. Templates include best-practice metric sets for aerospace and MRO, such as FPY by operation, turnaround time for MRO work packages, and documentation readiness for flight releases. Teams adapt layouts via low-code configuration without changing underlying KPI formulas, preserving governance.
From Insight to Action: Workflows Triggered by KPI Changes
Connect 981 dashboards are not passive. They tie to workflows and alerts triggered when KPIs cross thresholds: FPY below target on a key operation, cycle time exceeding takt for a high-priority contract, or MRO turnaround time at risk.
Use cases include:
- Automatically opening a quality investigation from a dashboard tile
- Launching a supplier escalation from a scorecard when defect rate spikes
- Initiating a capacity review when website and CRM metrics signal demand growth
AI-assisted root cause analysis lets users ask why FPY dropped on a particular program and see contributing factors like supplier changes, shift patterns, or new revision introductions. Every action is logged, supporting compliance, audits, and continuous improvement reviews.
Practical Examples: Manufacturing Dashboards Built with Connect 981
Example 1: Plant-Level OEE and FPY Dashboard for an Aerospace Machining Cell
A machining facility tracks OEE by machine, FPY by operation, and cycle time distribution for titanium components. Connect 981 combines MES machine data, quality inspection records, and tool-change events to highlight a specific spindle causing repeated FPY dips. Maintenance and process engineering trigger a corrective action workflow from the dashboard, document the fix, and track KPI improvement over subsequent weeks, replacing the weekly spreadsheet roll-ups that previously delayed action by days.
Example 2: MRO Turnaround Time and Parts Availability Dashboard
An MRO operation tracking landing gear overhaul TAT uses dashboards breaking lead time into waiting for parts, work in progress, and QA sign-off. Connect 981 correlates ERP purchase orders, inventory signals, and shopfloor task completion to separate material-induced delays from process-induced delays. A stacked timeline per work package shows red segments for delays, with KPIs for average TAT, late jobs, and parts availability heatmaps, helping prioritize procurement actions for upcoming maintenance windows.
Example 3: Supplier Performance and Cost-of-Quality Dashboard
A dashboard consolidates supplier defect rates, OTIF, and associated scrap/rework costs for key metallic and composite suppliers. Connect 981 ties QMS nonconformances, ERP cost data, and supplier codes into a unified view for quarterly business reviews. Users drill from a high-level supplier scorecard to part-level defect Pareto charts and batch-level history. The result: earlier issue detection, stronger supplier negotiations, and fewer line-stopping events.
Example 4: Linking Website, Sales Pipeline, and Capacity Dashboards
A cross-functional dashboard brings together website traffic from GA4, RFQ submissions, pipeline value from CRM, and available capacity from OEE and cycle time models. An aerospace supplier uses this to forecast staffing and machine investment as new programs ramp, rather than reacting mid-contract. The same governed KPIs feed executive reviews, replacing separate slide decks from marketing, sales, and operations that previously showed conflicting numbers. Connect 981 brings external digital signals and internal factory metrics into one governed kpi dashboard to support complete visibility and informed decision making.
Implementation Considerations: Getting Value from Manufacturing KPI Dashboard Software
Start with critical use cases rather than trying to digitize everything at once. An FPY improvement program on one cell or a TAT reduction initiative in one MRO bay gives you a focused pilot with measurable results.
Practical steps:
- Establish a KPI governance group with representatives from operations, quality, supply chain, and IT to own metric definitions
- Clean up master data: part numbers, routing steps, supplier codes, and shift definitions
- Validate historical baselines before going live so dashboards show meaningful insights from day one
- Train teams to use dashboards in daily standups, shift handovers, and supplier reviews, not just monthly reports
- Automated reporting helps maintain compliance with quality standards by ensuring consistent, traceable outputs
Connect 981 is designed for fast rollout with low-code configuration, drag-and-drop templates, and minimal IT overhead, making it practical for organizations still relying heavily on spreadsheets and paper.
Evaluating Manufacturing Analytics Software: How Connect 981 Compares
When selecting manufacturing analytics software in 2026, evaluate against these criteria:
|
Criteria |
Generic BI Tools |
Machine Monitoring Only |
Connect 981 |
|---|---|---|---|
|
Aerospace data model |
No |
Partial |
Yes |
|
Governed KPI catalog |
Manual setup |
No |
Built-in |
|
Serial number traceability |
No |
No |
Yes |
|
Workflow triggers from dashboards |
No |
Limited |
Yes |
|
Supplier collaboration |
No |
No |
Yes |
|
Commercial + ops in one view |
Possible with effort |
No |
Yes |
|
Speed of deployment |
Weeks to months |
Days |
Days to weeks |
Connect 981 is not just another dashboard tool. It combines manufacturing analytics, digital work instructions, shopfloor execution, and governed kpi dashboards in one layer. Ask yourself whether your current dashboards can answer multi-system questions like “Which suppliers most affect FPY on our top program?” as readily as a purpose-built platform.
Next Steps: Bringing Your Manufacturing KPIs into One Governed Dashboard
Manufacturers need more than charts. They need governed manufacturing kpi dashboard software that ties data, definitions, and actions together into a unified view. The benefits are concrete: standard KPIs, reduced reporting drift, smarter decisions, faster root cause analysis, and cross-team alignment from the shop floor to the C-suite.
Here is a starting plan:
- Pick one plant or program
- Choose 10-15 critical KPIs (OEE, FPY, cycle time, TAT, supplier quality, pipeline health, defect rate)
- Pilot a unified manufacturing dashboard with governed definitions
- Expand based on results
If your teams are still reconciling spreadsheets, debating KPI definitions in meetings, or building dashboards that no one trusts, it is worth evaluating Connect 981. The platform sits on top of your existing ERP, MES, QMS, CRM, and digital analytics stack without requiring a rebuild. Request a demo to see how it works with your data, your metrics, and your operational reality.
The path from scattered reports to a governed manufacturing analytics environment does not require replacing everything. It requires connecting what you already have and governing it properly. That is what Connect 981 was built to do.


Related Blog

Built for Speed, Trusted by Experts
Whether you're managing 1 site or 100, Connect 981 adapts to your environment and scales with your needs—without the complexity of traditional systems.
